Tutorial on MS-Dial 5
1.0 Introduction to MS-Dial
MS-DIAL is a powerful, open-source software tool designed for the comprehensive analysis of mass spectrometry data, whether for untargeted metabolomics or lipidomics. One of its standout features is its compatibility with a wide range of instruments, including GC/MS, GC/MS/MS, LC/MS, and LC/MS/MS systems, and support for major vendors such as Agilent, Bruker, LECO, Sciex, Shimadzu, Thermo, and Waters. In this latest version, MS-DIAL enhances the user experience by eliminating the need for data format conversion into the ABF format—although it is still supported. Users can now directly import raw MS data. Still, the data can now be imported directly to MS-Dial. MS-DIAL provides a comprehensive ‘start-up kit’ that includes several MSP files with both EI- and MS/MS spectra to facilitate ease of use. MS-DIAL includes an internal version of the Fiehn lab’s GC/MS database, oriented by the FAME RI index, as well as an in-silico retention time- and MS/MS database for LC/MS/MS-based lipidomics. Additionally, MS-DIAL facilitates isotope-labeled tracking in LC/MS projects, making it a powerful tool for detailed metabolic studies and precise quantification. Its user-friendly graphical interface combined with broad functionality makes it a key resource for researchers conducting multi-omics studies (Figure 1).
2.0 Importance of MS-Dial 5
The latest version of MS-DIAL 5 aims to be the most versatile tool for multi-omics data analysis and therefore supports direct injection, many separation (GC, LC, CE, SFC), ionization (EI, ESI, MALDI), fragmentation (CID, HCD, ETD, ECD, EIEIO, EID, OAD) and MS/MS (DDA, SWATH, AIF) datasets. In addition, technological advances in fragmentation mechanisms such as electron-impact excitation of ions from organics (EIEIO) have also been taken into account, making it possible to work with these types of data to offer comprehensive structural identification of metabolites, lipids, and proteins. These resources enhance the identification and quantification of metabolites and lipids. After data processing which includes peak picking, deconvolution, compound identification, and peak alignment, MS-DIAL provides several normalization methods (including LOWESS) and a multivariate analysis by principal component analysis (PCA). Finally, for further analysis by other programs, this program can export your result as table format (for SIMCA-P, MetaboAnalyst, and MetFamily etc.), and as several spectral formats including NIST, MassBank, and Mascot formats for compound identifications by MS-FINDER, CSI:FingerID, CFM-ID, MetFrag, and MetFamily etc.
3.0 The differences between MS-DIAL 4 and MS-DIAL 5:
Graphical User Interface (GUI):
MS-Dial 4: Functional but slightly less refined.
MS-Dial 5: Improved GUI with more intuitive workflows and better user experience.
Speed and Performance:
MS-Dial 4: Effective but slower on larger datasets.
MS-Dial 5: Optimized for faster data processing, especially for large, multi-omics datasets.
Annotation Capabilities:
MS-DIAL 4: Limited to using one database and annotation level in a single analysis. Provides comprehensive annotation of metabolites and lipids through spectral matching using established databases.
MS-DIAL 5: Enables the use of multiple databases and annotation levels within the same analysis. Significantly improves annotation accuracy by incorporating ion mobility spectrometry (IMS) data and enhanced spectral deconvolution. MS-DIAL 5 also has better integration with larger and more updated databases, improving the annotation of complex molecules like lipids, metabolites, and isomers.
Annotation Capabilities:
MS-DIAL 4: Offers only one possible annotation candidate per analysis.
MS-DIAL 5: Provides multiple annotation candidates from different databases, improving identification accuracy. Adds support for ion mobility spectrometry (IMS), enabling better separation of ions that share the same mass-to-charge ratio (m/z) but have different drift times. This improves separation in complex biological mixtures.
Isomer Separation:
MS-Dial 4: It will support basic functionality.
MS-Dial 5: Enhanced separation of isomers and similar molecular species.
Peak Picking and Alignment:
MS-Dial 4: Accurate, but sometimes slower or less accurate with noisy data.
MS-Dial 5: Refined peak picking and alignment algorithms for better performance, especially with complex datasets.
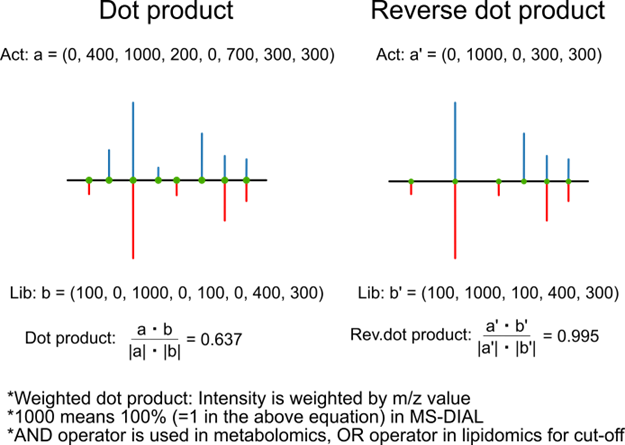
Score calculation:
MS-Dial 4: Utilizes the score calculation below.
MS-Dial 5 (versions released before July): Utilizes square of the score calculation below.
MS-Dial 5 (versions released after July): Utilizes the score calculation below.
Data Formats:
MS-Dial 4: Supports only (.ABF) format.
MS-Dial 5: Further extended support for newer formats, including advanced mass spectrometry data.
Separation Techniques:
MS-DIAL 4: Supports separation methods like LCMS, LCIMMS, and GCMS.
MS-DIAL 5: Adds support for direct infusion MS (DIMS) and ion mobility MS (IMMS), broadening the range of separation techniques.
Collision Types:
MS-DIAL 4: Works with CID and HCD collision types.
MS-DIAL 5: Extends support to additional collision types, including ECD, HotECD, EIEIO, EID, and OAD, offering more advanced fragmentation methods.
Targeted Omics:
MS-DIAL 4: Focuses on metabolomics and lipidomics analysis.
MS-DIAL 5: Expands its capabilities to include proteomics, in addition to metabolomics and lipidomics.
Flexibility in MS Methods:
MS-DIAL 4: Only one MS method (DDA, SWATH, AIF) can be applied in each analysis.
MS-DIAL 5: Allows multiple MS methods to be applied to a single analysis, enabling more comprehensive data analysis.
Undo/Redo Functionality:
MS-DIAL 4: Does not offer an undo/redo feature when changing an annotation to unknown.
MS-DIAL 5: Introduces this capability, making it easier to revert or correct annotation changes during data processing.
4.0 Step-by-step guide on how to set up a project in MS-DIAL 5
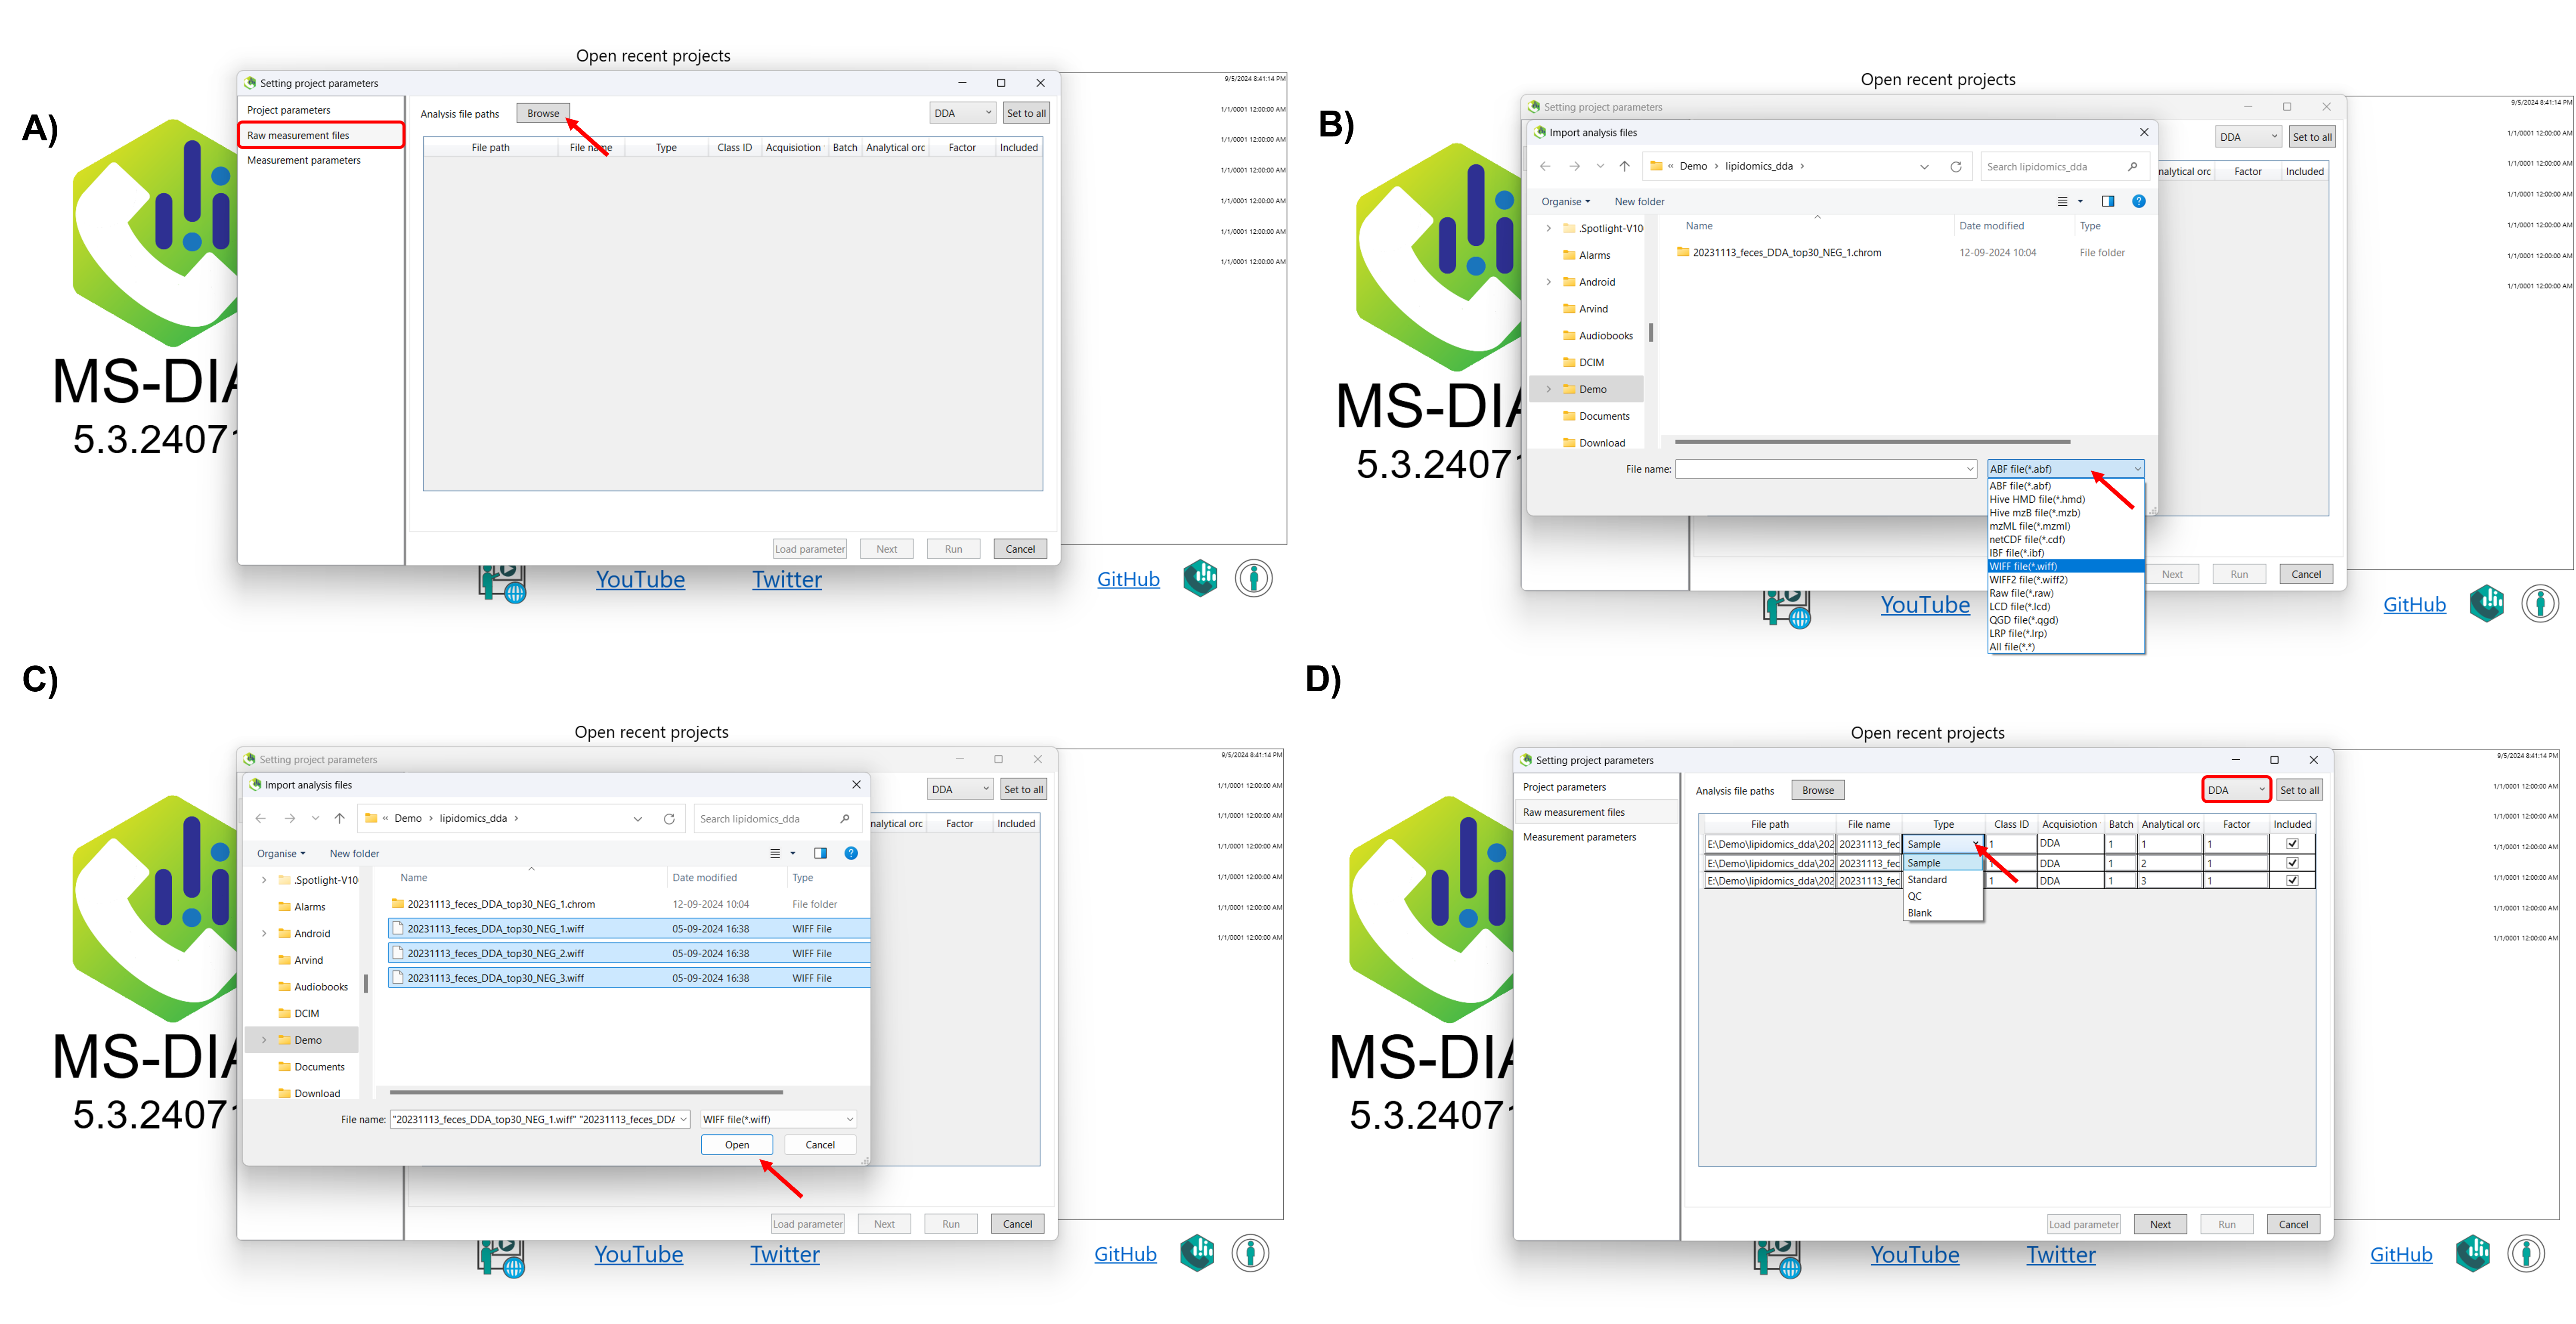
This tutorial demonstrates how to start a new project in MS-DIAL 5, covering the steps to import raw data and set the MS method type. To begin, launch MS-DIAL 5 from your desktop or application menu, which will open the main user interface with various options and toolbars. The first step is to create a new project by setting up a dedicated folder where all project files, including raw data and results, will be stored. After selecting New Project from the “File” menu, choose the designated folder to ensure data is organized. Next, you can import raw data directly into MS-DIAL 5 without the need for conversion to ABF format. After selecting your raw data files, proceed to configure the MS method type according to your experiment, ensuring the appropriate settings are in place for accurate data analysis. This streamlined process sets the foundation for efficient data processing in MS-DIAL 5 (Figure 2).
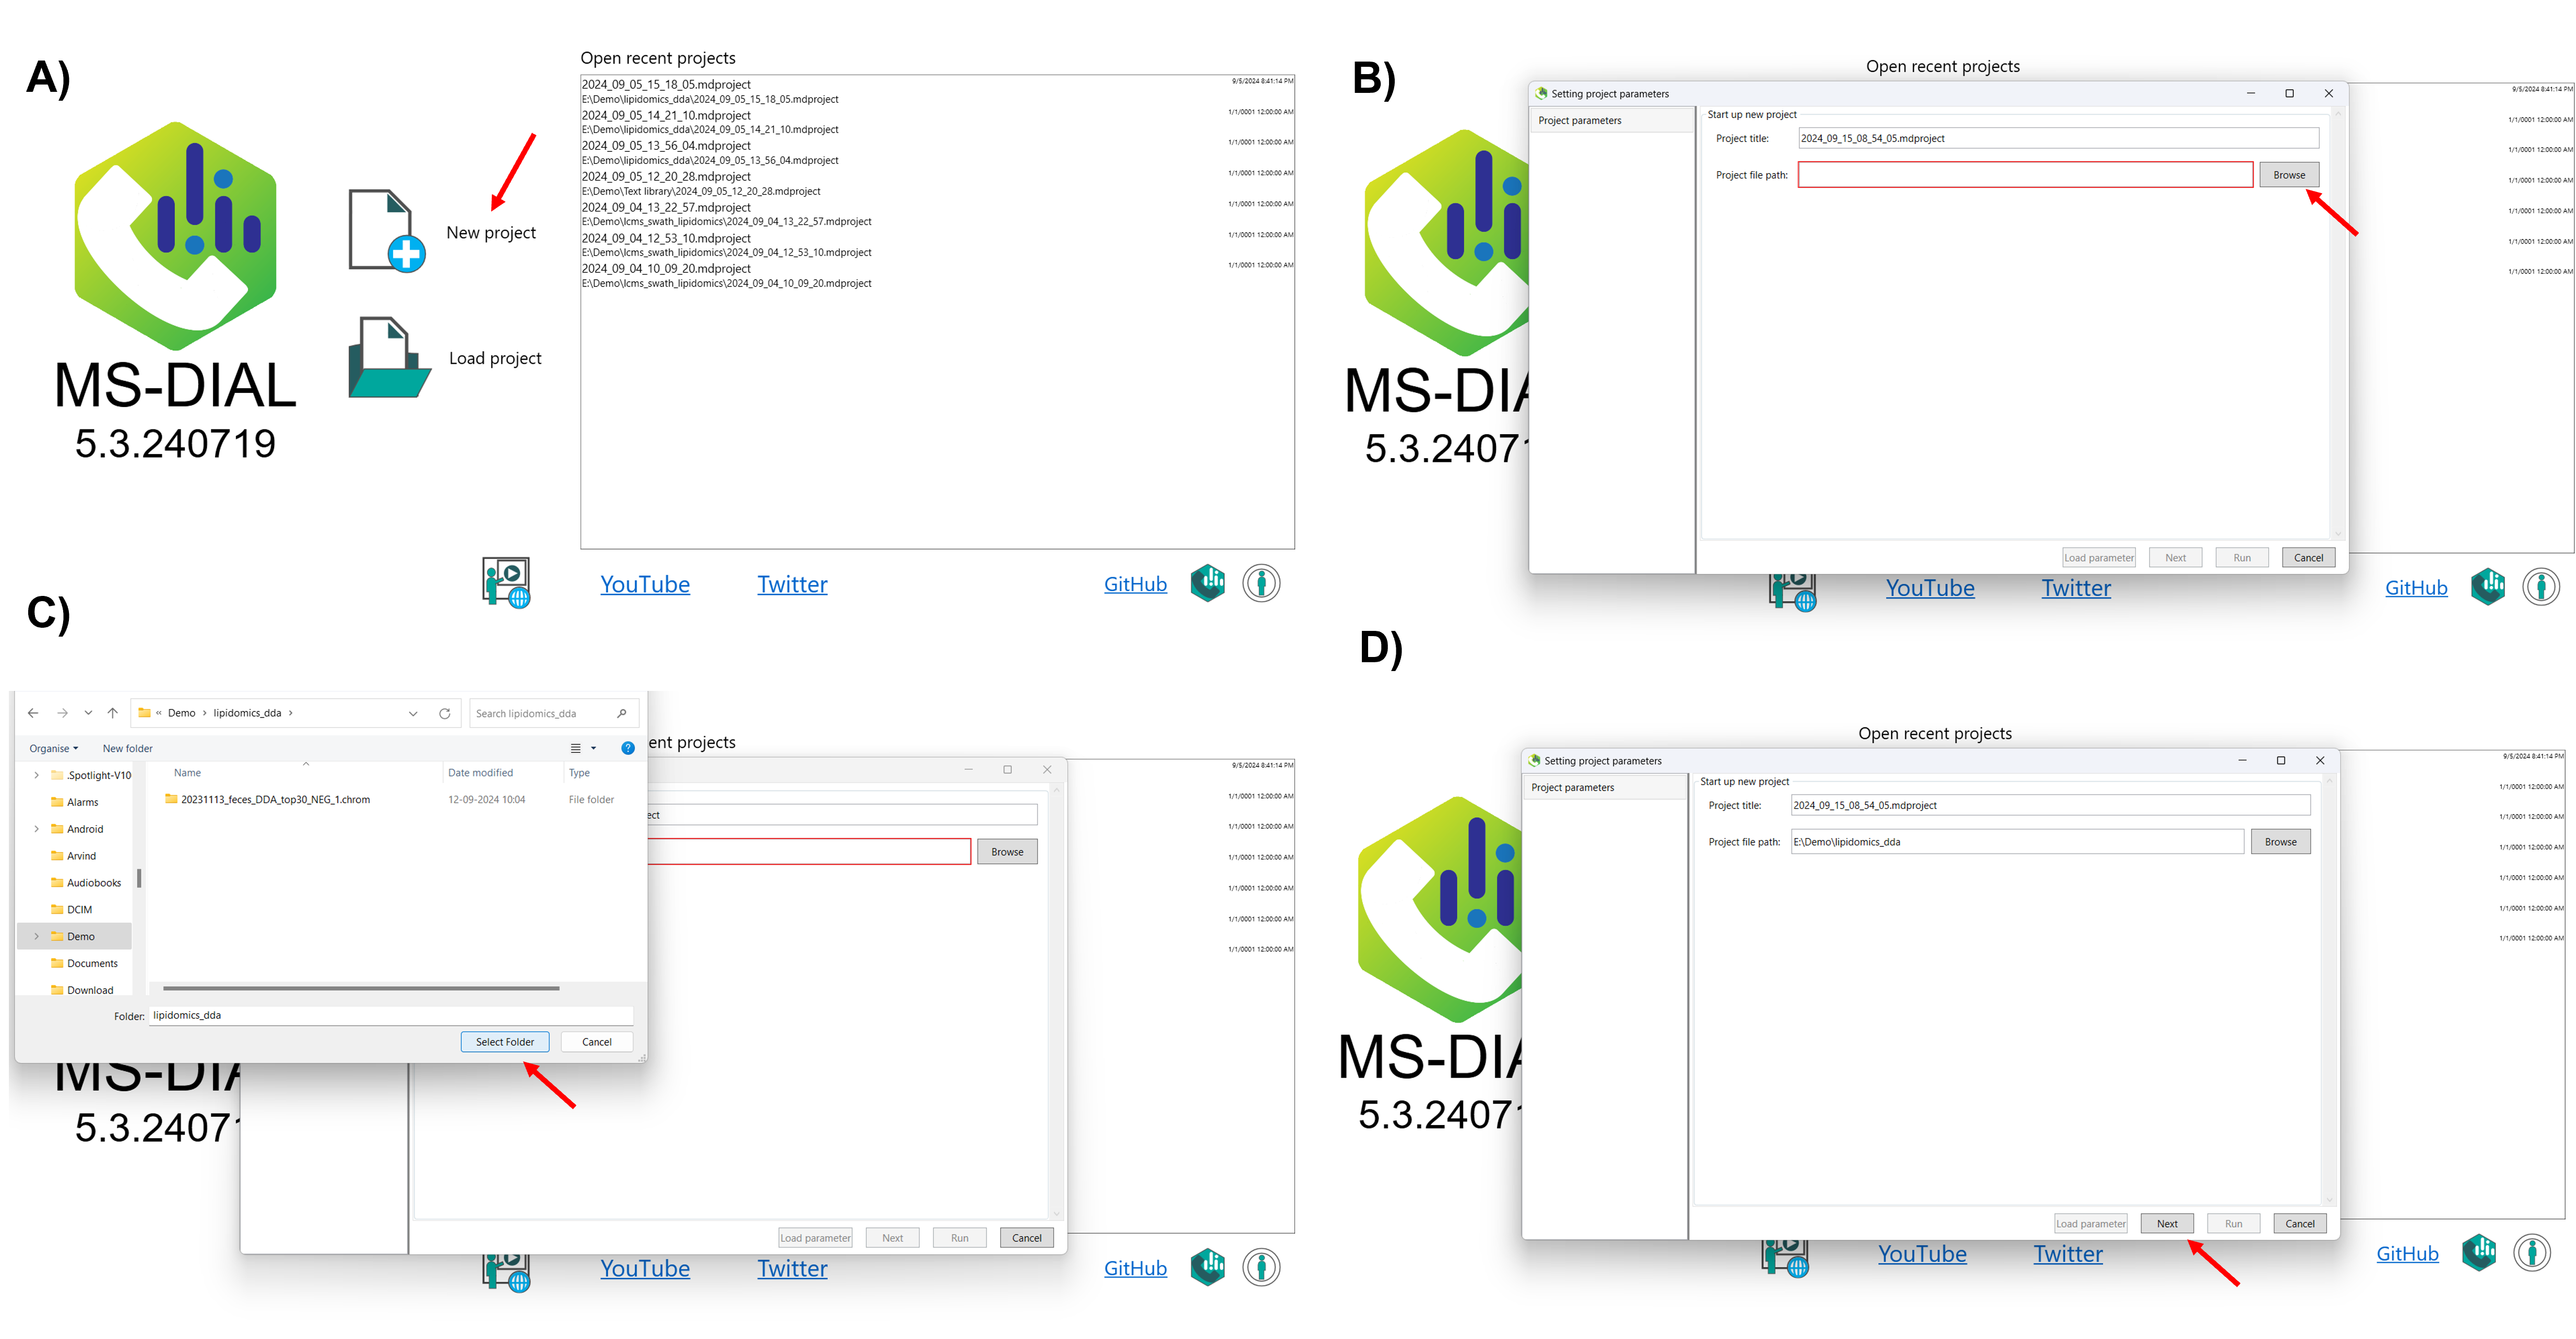
After selecting the project folder, click on Browse in the raw measurement file section, and navigate to the folder where your raw data is stored. Select the raw files you wish to analyze, or simply drag and drop your files (including .d format files) directly into MS-DIAL 5. Once you’ve selected the appropriate files, click Open to import them. After importing your raw data, you can further assign identifiers to your measurements based on sample type (e.g., Sample, Standard, QC, Blank). You can also categorize them by class ID, according to your experimental design. At this point, you need to set the acquisition type for each raw data file.
Here’s how to set the MS method type:
DDA (Data-Dependent Acquisition): Select this if you are analyzing single MS or data-dependent MS/MS data.
DIA (Data-Independent Acquisition): Choose this option when analyzing SWATH or AIF data, where MS/MS data is acquired independently of precursor ions.
For a detailed walkthrough on selecting the acquisition type, refer to the video linked below, which demonstrates the process visually.
After selecting the acquisition type, you can further customize your project by setting additional parameters. If your analysis involves multiple batches, you can assign batch numbers to differentiate between them and account for batch effects during data processing. You can also specify the analytical order of your samples, which is useful for tracking trends such as signal drift or other variations that may have occurred throughout the run. Additionally, you can set a dilution factor for each sample, allowing MS-DIAL to adjust the quantification accordingly. If certain samples are not needed for further analysis, you can choose to exclude them from the data processing (Figure 3).
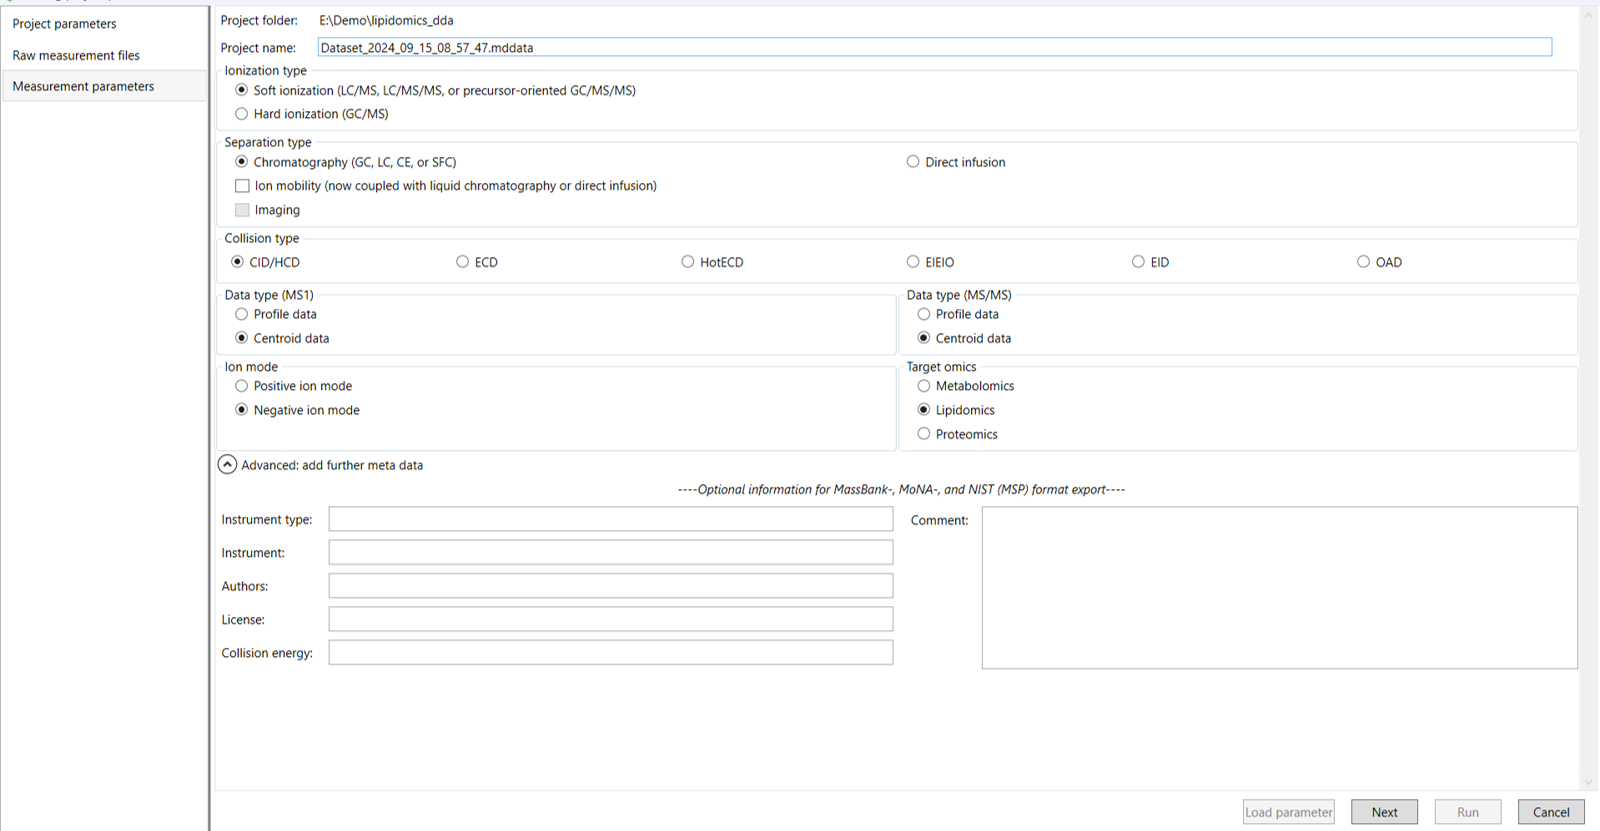
After assigning identifiers to the raw measurement files, click Next to proceed to the Measurement Parameters tab. In this section, you will input the analytical and instrumental parameters that were used during data acquisition. These settings are crucial for ensuring accurate data processing and should align exactly with the experimental conditions under which the measurements were taken (Figure 4).
The following sections will offer detailed instructions on how to select and configure each parameter within the Measurement Parameters section
4.1 Measurement Parameters Section:
1. Ionization type: Select the soft ionization type, when you are analyzing the ESI data or select hard ionization type when you are analyzing the EI data.
2. Separation type: Select chromatography (for LC, GC, CE, or SFC) or direct infusion method as per your analysis. Additionally, you can check ion mobility box coupled with one of the previous options.
3. Collision type: Select the corresponding collision type according to your analysis.
4. Data type (MS1): Select the profile or centroid data as per your analysis in MS1.
5. Data type (MS/MS): Select the profile or centroid data as per your analysis in MS/MS.
*Refer to the tutorial on MS-Dial on how to determine profile or centroid data type for your analysis using the Rawdataviewer tool in the below link.
https://systemsomicslab.github.io/msdial5tutorial/Determining%20MS%20data%20types.html
6. Ion mode: Select the corresponding ion mode according to your analytical setup.
7. Target Omics: Select what kind of omics data you want to perform. If you select the ‘lipidomics’ project, you do not have to prepare NIST MSP format library since MS-DIAL internally contains the theoretical MS/MS spectra of lipids (and actually, the fragment ions are future evaluated by the decision tree algorithm to provide the proper lipid structure representation). On the other hand, when you select the ‘metabolomics’ project, your own MSP file will be required for compound identification.
8. Advanced option: You can provide additional information regarding your experiment. This metadata will be included in the MassBank, MoNA and NIST (MSP) format export.
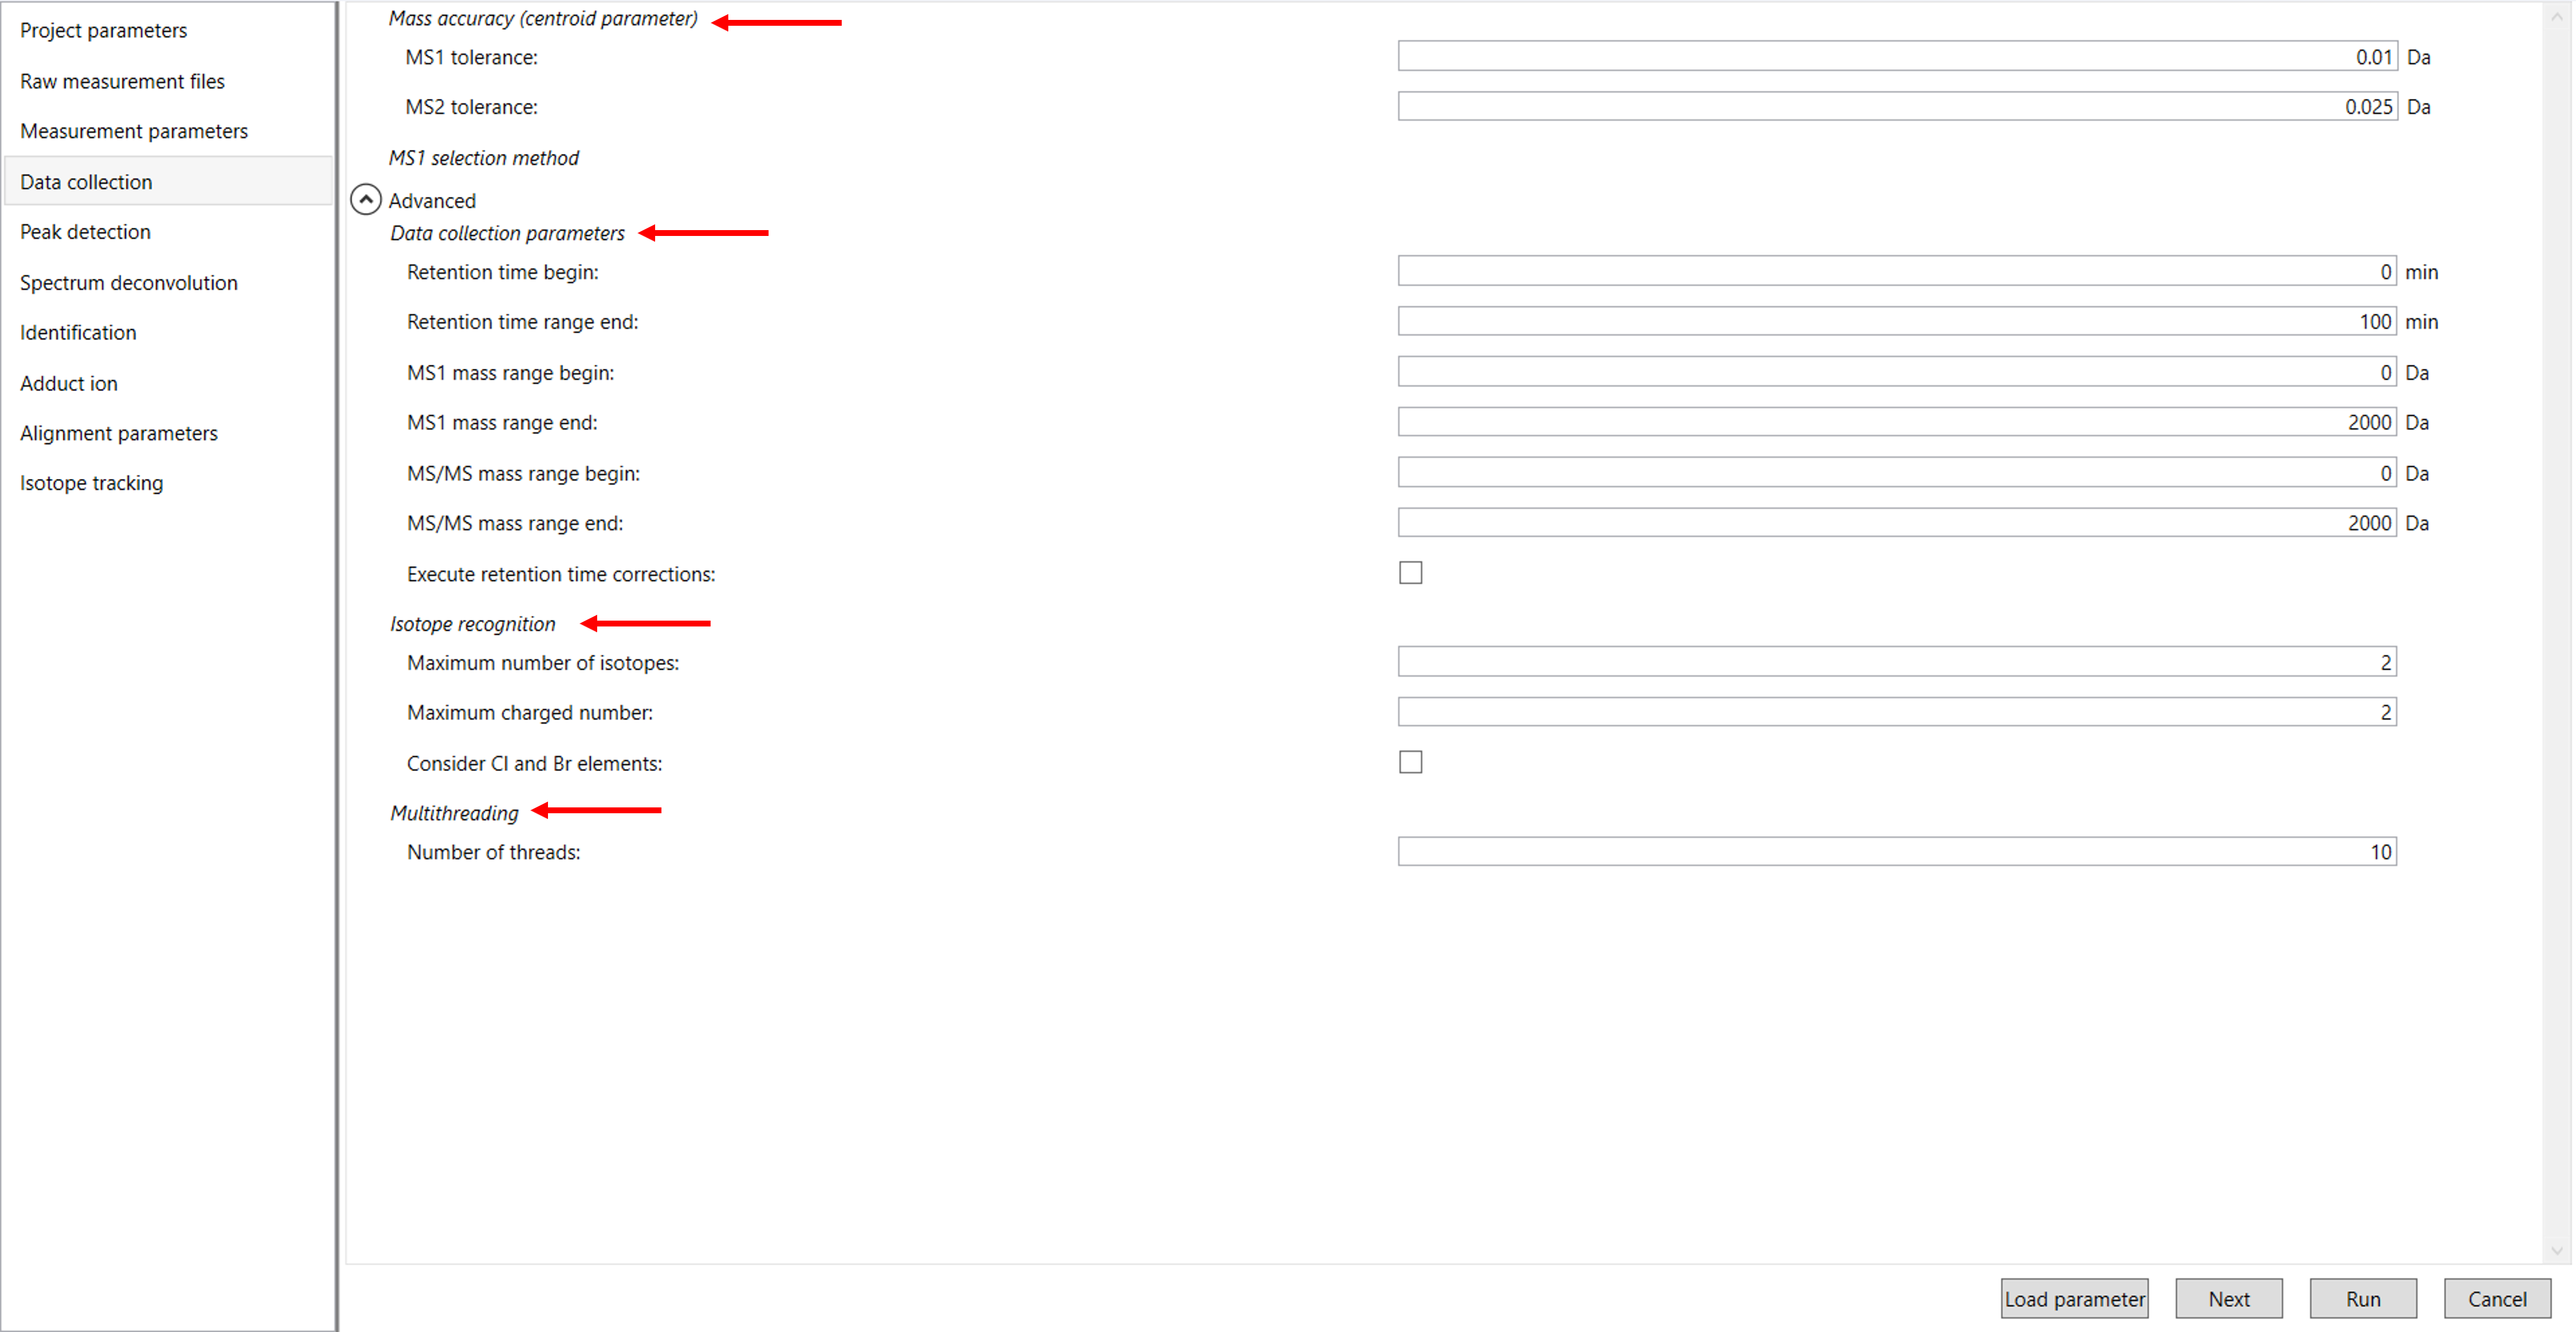
After configuring each parameter in the Measurement Parameters section, click “Next” to proceed to the Data Collection tab. In this section, you will need to enter the data collection parameters that were used during the acquisition of your samples. These parameters are essential for accurately processing and analyzing your data according to the conditions of your experiment (Figure 5).
The upcoming sections will provide detailed instructions on how to set each parameter in the Data Collection section.
4.2 Data collection parameters:
Mass accuracy (Centroid parameter): After the initial peak detection in MS-DIAL, mass tolerance defines the acceptable range of mass deviation for both MS1 and MS/MS data. By default, mass tolerance values are set to ±0.01 Da for MS1 and ±0.025 Da for MS/MS. This means that peaks within these ranges around the detected mass are integrated and considered for further analysis. Importantly, the MS/MS tolerance also influences how MS/MS chromatograms are constructed, affecting how closely the detected fragment ions need to match the theoretical masses to be included in the MS2Dec deconvolution process.
Data collection parameters: In MS-DIAL, you can define the analysis ranges as per your analysis for retention time (RT), MS1, and MS/MS axis to focus on specific parts of your data. For this demonstration, we have chosen the expected data range as follows: In this demo data RT range is 0 - 100 min, and the MS and MS/MS range is 0 – 2000 Da.
Execute Retention Time Correction: This setting adjusts for any shifts or drifts in retention times that may occur during the analysis, ensuring that peaks are aligned accurately across different samples or runs. Use this function when you analyze your data on different elution conditions (eg., different columns).
Isotope Recognition: Isotope recognition is used to identify and handle isotopic peaks that correspond to the same molecular ion but with different masses due to natural isotopic variations (e.g., [M+1] or [M+2]). This process helps in accurately quantifying the main molecular ion by distinguishing it from its isotopic counterparts. As long as you focus on small molecule research (less than 2000 Da), the maximum charged number can be set to 2. On the other hand, the parameter can be changed to 8 or more to process proteome or snRNA research data.
Consider Cl and Br Elements: If you assume your samples might contain chlorine (Cl) or bromine (Br), enable this option as these elements have unique patterns in their isotopic distribution. This setting helps to accurately identify and quantify compounds by recognizing the specific isotopic peaks that Cl and Br create.
Multithreading: Please set the count of threads that you want to use. You can check the maximum thread counts in resource monitor. (open task manager->open resource monitor).
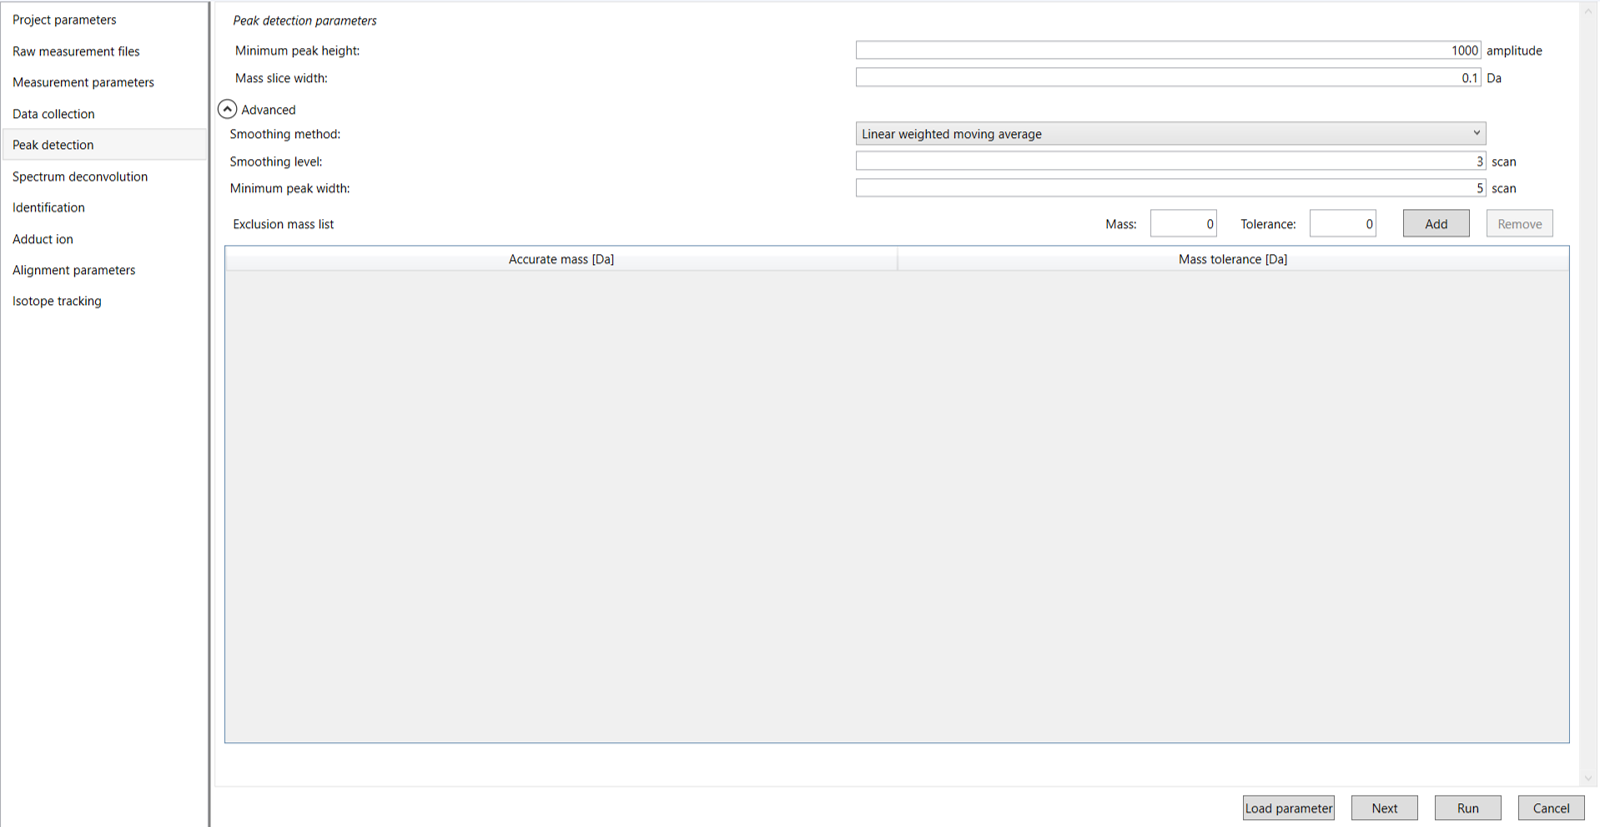
Click Next to proceed to the Peak Detection Parameter Settings. In this section, you’ll need to enter the parameters used for peak detection in your mass spectrometry data. This includes specifying values such as the minimum peak height, mass peak width, and exclusion mass list (Figure 6).
The following sections will offer detailed guidance on how to configure each parameter within the Peak Detection section
4.3 Peak detection parameter:
Minimum Peak Height: Set the minimum intensity level required for a peak to be detected in your data. Peaks with heights below this threshold will be ignored, which helps in filtering out noise and focusing only on significant signals for accurate analysis. Ideally, users put values here based on their own experience that you are looking at the trend of your data. However, based on our experience, the minimum peak height may be set to 1000 as a default value for this demo data. Besides, for FT-MS or Orbitrap data, the minimum peak height maybe 10,000 or more.
Refer to the tutorial on how to determine the minimum peak height for your analysis using the Rawdataviewer tool in the link below.
Mass Slice Width: Define the range of mass-to-charge ratios (m/z) around each detected peak that will be considered during data analysis. This width helps in grouping ions within a specified m/z range to improve peak detection and quantification by accounting for slight variations in mass measurements. In this case, we are using 0.1 Da. From our experience, 0.1 and 0.05 are suitable for Q-TOF and Orbitrap, respectively.
Smoothing method:Linear-weighted moving average is used for the peak detection as default to accurately determine the peak left- and right edges.
Smoothing level: The recommended smoothing level is 1-3. It is the number of points on each side of the peaks.
Minimum peak width: Minimum peak width indicates a threshold of peak width for filtering. For example., we choose a minimum peak width set to 5 scans, peaks that span less than 5 scans will be excluded from the results. Only peaks with a width of 5 scans or greater will be included in the analysis.
Exclusion mass list: If you already know unwanted m/z peaks because of columns or solvent contaminants, you can specify them to exclude those peaks.
Click Next to proceed to the Spectrum Deconvolution Parameter Settings. In this section, you will configure the parameters for deconvoluting your mass spectrometry data. Key settings include the sigma window value, the MS/MS abundance cut-off value, and the option to exclude peaks following the precursor ion (Figure 7).
The following sections will provide detailed instructions on how to set each parameter within the Spectrum Deconvolution section.
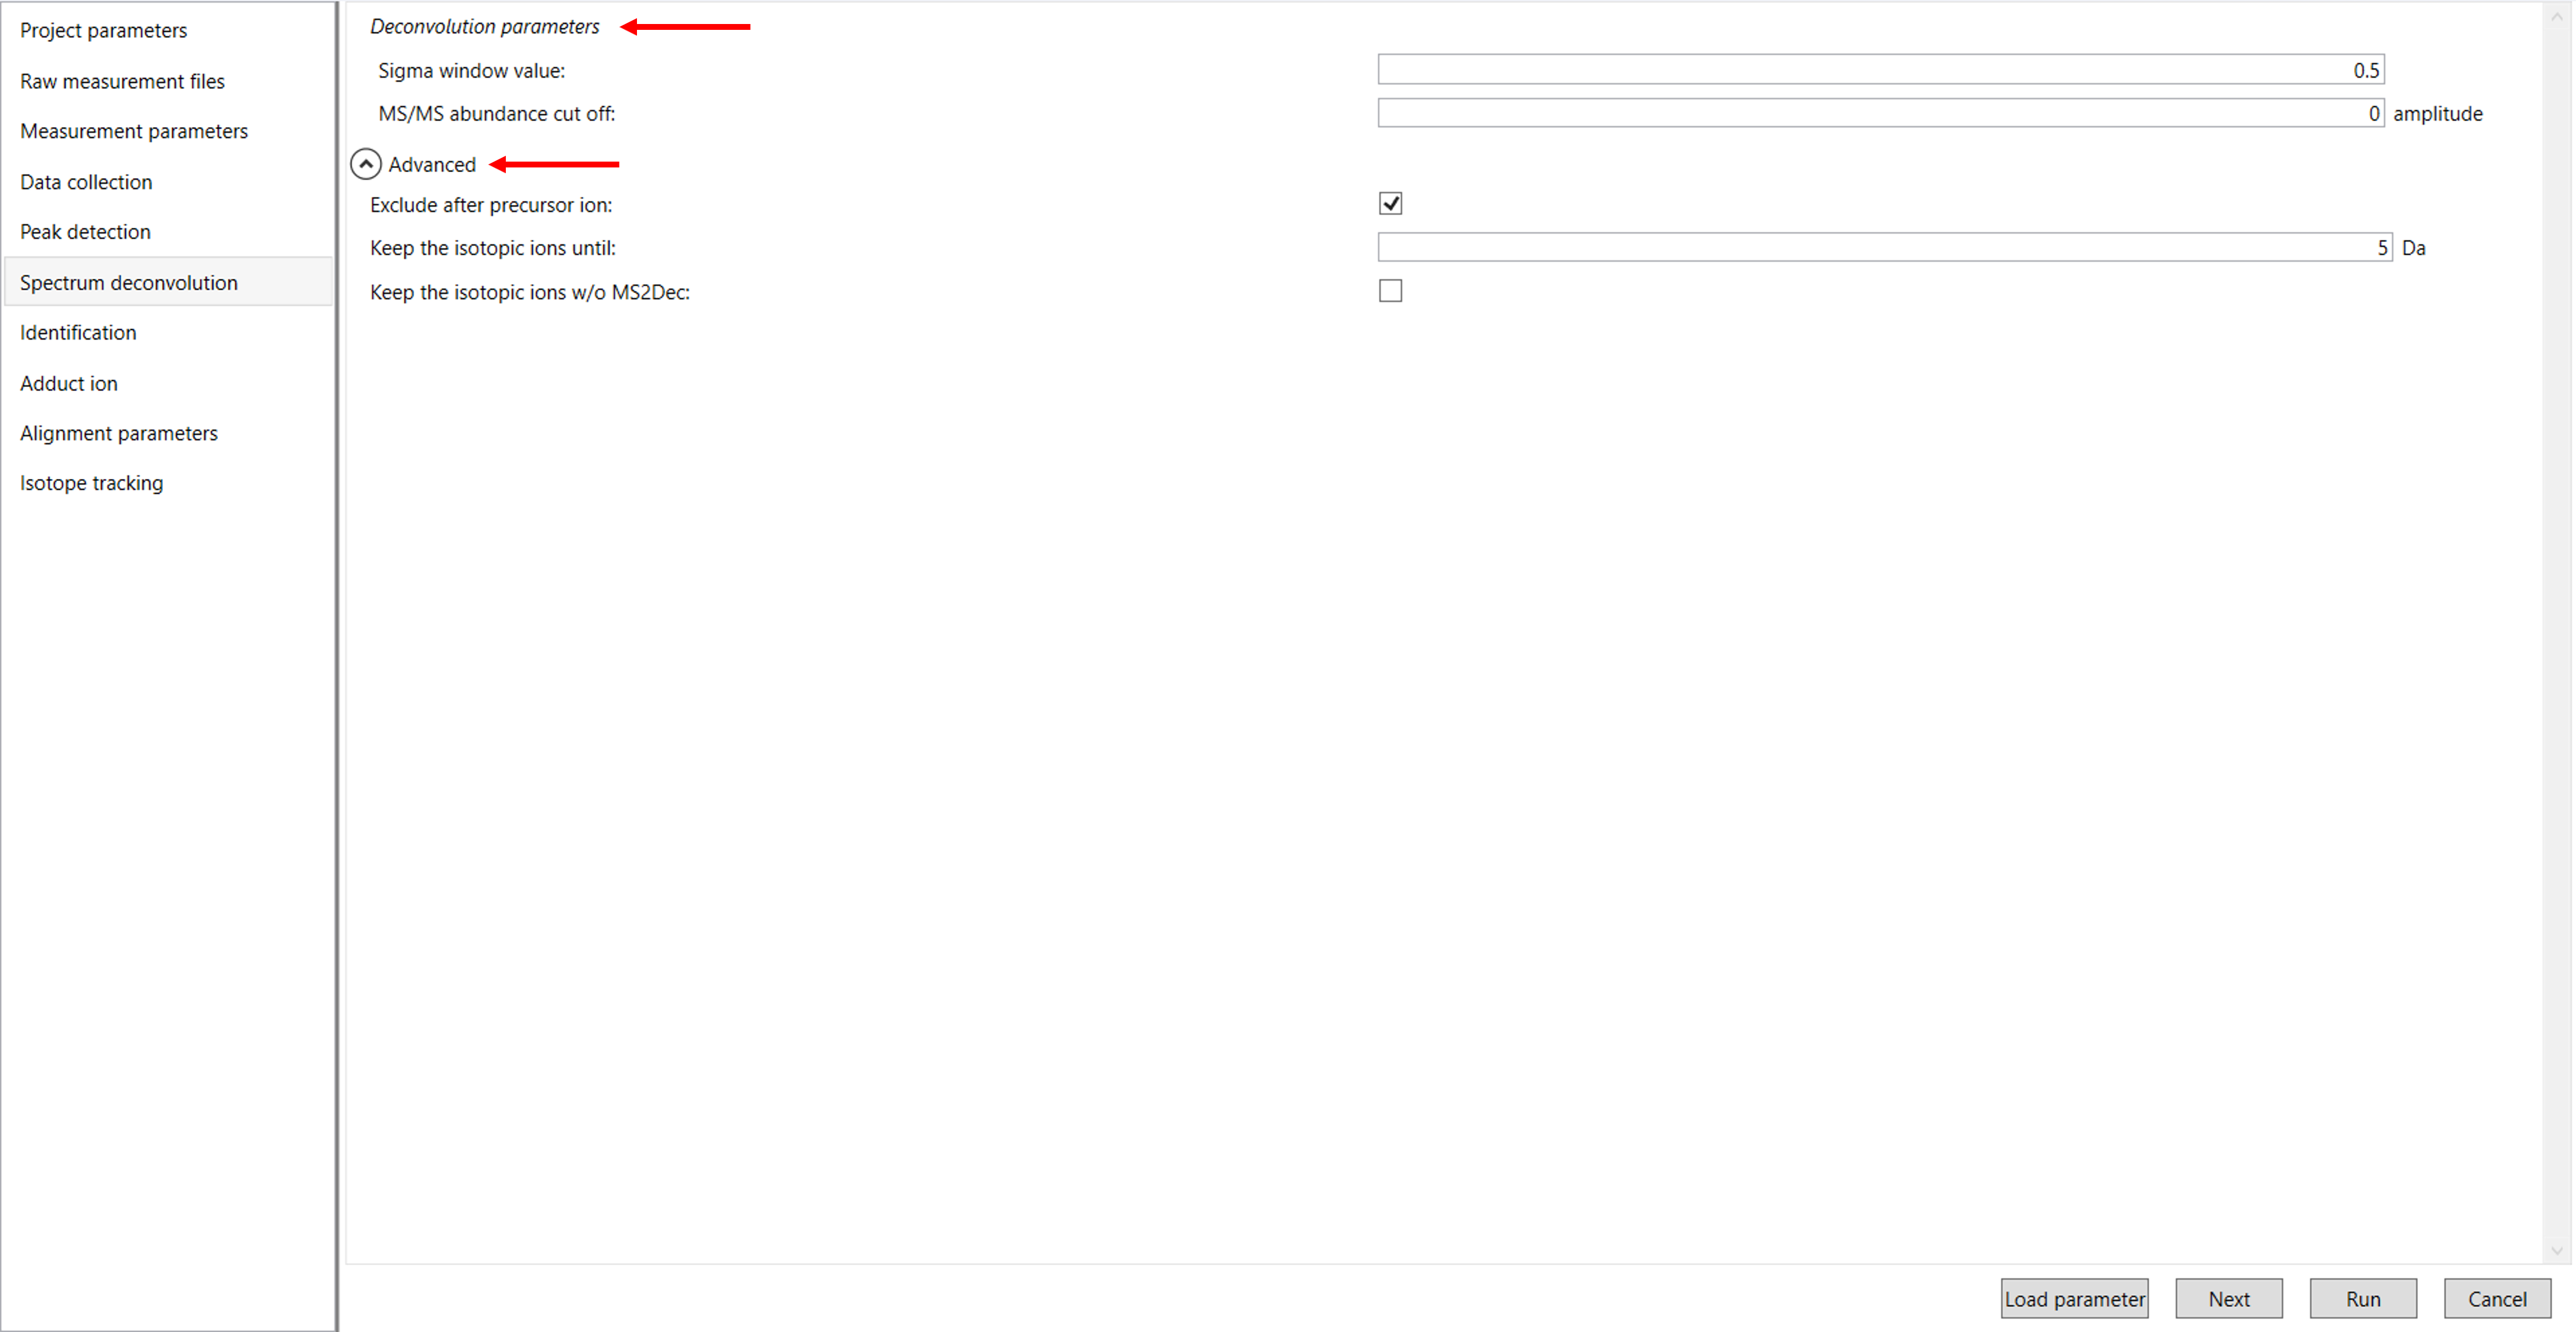
4.4 Spectrum deconvolution parameter:
Sigma window value: The sigma window value is highly affected by the resolution of deconvolutions. A higher value (0.7-1.0) will reduce the peak top resolutions, i.e. the number of resolved peaks will be decreased. On the other hand, a lower value (0.1-0.3) may also recognize many noise chromatographic peaks. In our demo data, we have chosen 0.5.
MS/MS Abundance Cut-off: MS/MS Abundance Cut-off refers to the minimum intensity level of the MS/MS (tandem mass spectrometry) signals that must be reached for a fragment ion to be considered significant and included in the analysis. Unless you have data-independent MS/MS data sets, you can skip this part. However, you may set a cutoff value to reduce the MS peak noise levels.
Exclude after precursor ion: If you want to remove the product ions after the focused precursor ion (recommended for metabolomics and lipidomics), check this box.
Keep the isotopic ions until: In fact, the isotopic patterns in MS1 spectra are frequently disturbed. On the other hand, there are some cases that the isotopic patterns in MS/MS spectra are clearer than that of MS1 spectra, which can be used for the accurate annotation of molecular formula. If you set this parameter as 5 Da, the ions until precursor + 5 Da are kept after MS2Dec algorithm is finished.
Keep the isotopic ions w/o MS2Dec: The MS2Dec algorithm may sometimes erase the precursor’s isotopic ions due to the mathematics issues. Therefore, you can keep the raw MS/MS spectra only for the precursor’s isotopic ions by checking this option.
Click Next to proceed to the Identification Parameter Settings. In this section, you will configure parameters related to the identification of compounds, including the database type, lipid profiling settings, annotation options, and retention time settings (Figure 8).
The following sections will provide detailed instructions on how to set each parameter within the Identification section.
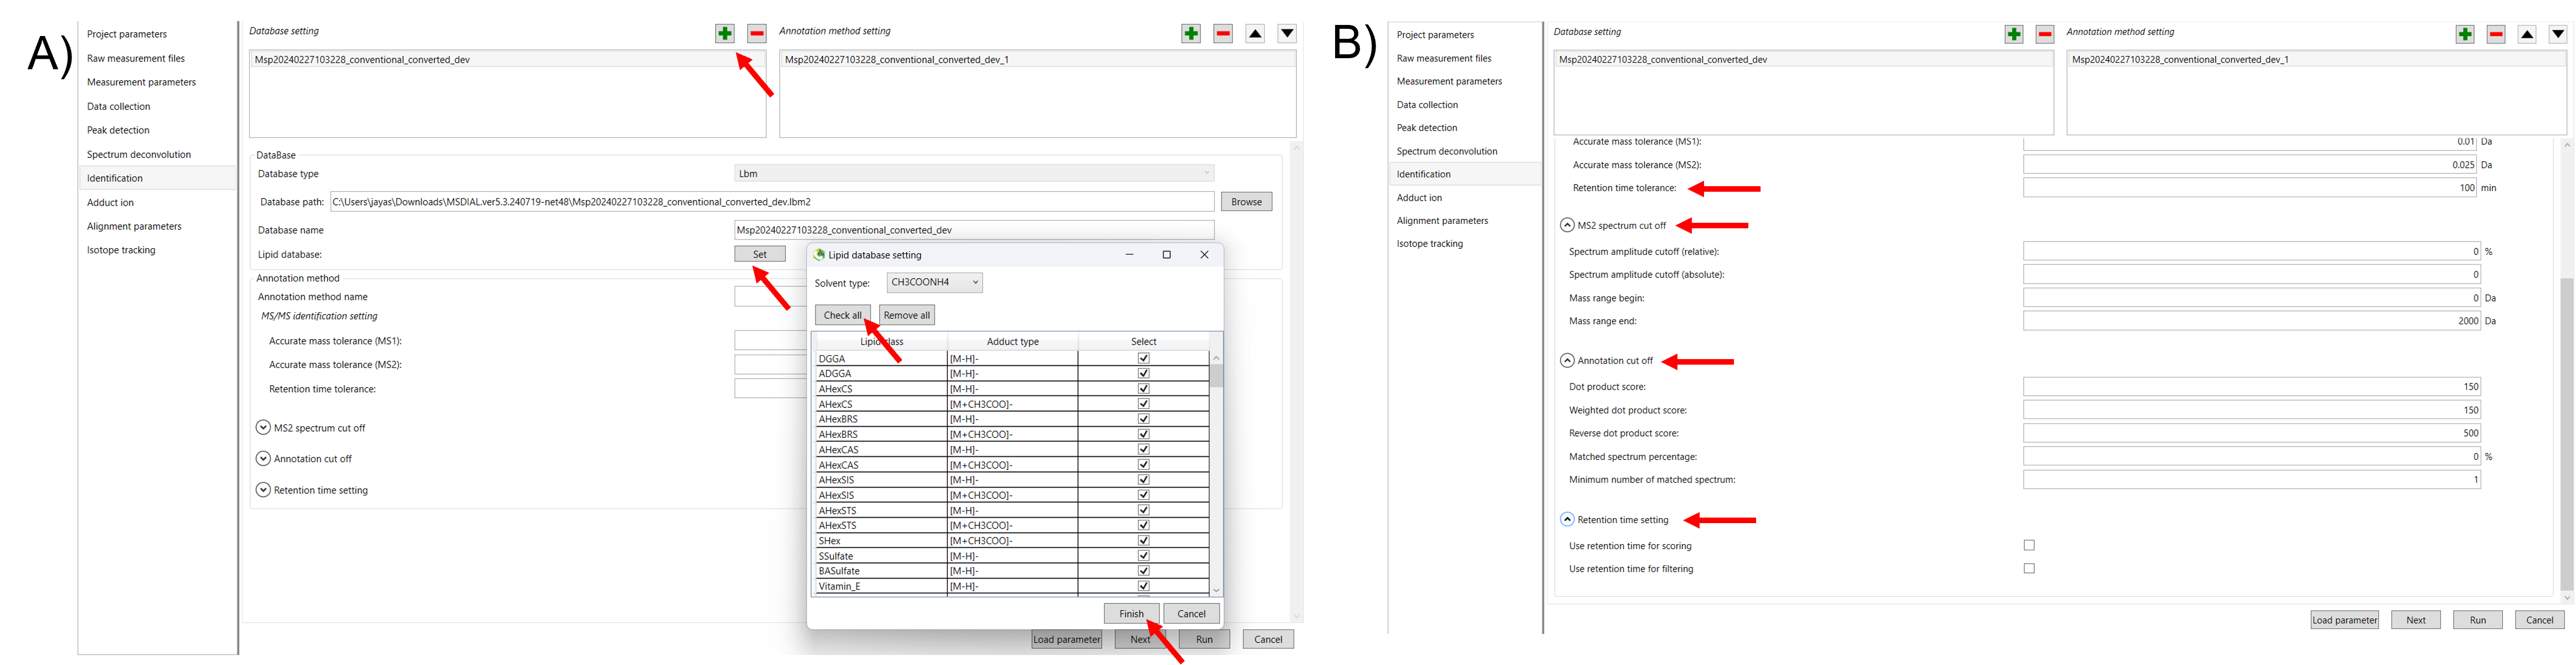
4.5 Identification parameter:
MSP file: In the case that you selected the ‘lipidomics’ project, select what you want to annotate in your data sets for lipid profiling. For example, we selected all the lipids to analyze in our data. For this tutorial data, in which ammonium acetate was used as a solvent type, select HCOONH4 (ammonium formate) as the solvent type in the window ‘Lipid database setting, although nowadays CH3COONH4 (ammonium acetate) is basically used as a solvent type.
If you are selected as a metabolomics project, insert the MSP file. Several MSP files are downloadable as a starter kit for MS-DIAL using below link
https://systemsomicslab.github.io/compms/msdial/main.html
MS-DIAL supports the MSP file format in ASCII text. In addition, the software can utilize “RETENTIONTIME:”, “PRECURSORTYPE:”, and “FORMULA:” information for metabolite identification (cases are ignored). Retention time information must be specified in minutes [min] scale when possible. The adduct ion information, i.e. here ‘Precursor type’, will be used for the adduct ion search algorithm. You can also insert your own MSP file by clicking “+” icon in the database setting. Select that MSP file and click on the upper arrow in the annotation method setting to give a first preference.
Text format library: MS-DIAL also supports a tab-delimited text format library for peak identification using retention time and MS1 accurate mass information. The identification process is performed after completing peak identification based on the MSP format library. This is why we call this identification processing “post-identification”. The first row should include header information. The first, second, third, and fourth columns should contain the metabolite name, accurate mass [Da], retention time [min], and adduct ion, respectively. This library can be easily created in Microsoft Excel. Save the spreadsheet in “Tab-delimited text format”. This option is useful for internal standard identifications etc. (Even if you don’t have MS/MS libraries, the peak identification based on retention time and accurate mass is available from this option). * The minimum requirement for this text library is just ‘metabolite name’ and ‘m/z’ information; i.e. the first two columns are required. Retention time and adduct ion fields provide additional information for MS-DIAL in peak identification and adduct ion picking, respectively.
Refer to the tutorial video on MS-DIAL for guidance on how to import a text library file using the link below.
Annotation method: If you put RT information in your MSP file, set the RT tolerance value. For example, the predicted RT information is optimized for the 15-min LC method. If you set the RT time tolerance to 1.5 min for your data. It will compare the RT of the same lipid/metabolite in different sample. If the difference is high means it will not consider that peak in all the samples. If suitable RT information is unavailable, set the tolerance to 100 (default) or larger (larger than your LC time). The two mass tolerances for MS1 and MS2 are required for the compound search and are dependent on your instrument performance.
MS2 spectrum cut-off: The minimum intensity value for ions to be considered during analysis. Any fragment ions with intensities below this threshold are excluded from the spectrum, helping to reduce background noise and improve the quality of data interpretation. The mass spectrum peak less than the user-defined value will not be used for the MS/MS similarity calculation. Also, enter the mass range at the beginning and end. If you don’t have information no need to enter. Use the default values.
Annotation cut-off: In MS-DIAL, these parameters are crucial for determining how closely your experimental spectra match reference spectra from databases during the identification process. They help score the similarity of fragmentation patterns compared to the record in the database. If the MS/MS has5 peaks for 1 compound, if you give for example., 60%, then 3 peaks should match with a reference database. It is also the same for the minimum number of matched spectra. If you don’t have information no need to give any values. Use the default values.
4.5.1 Retention time setting:
Retention time scoring and filtering: If you set the tolerance and you selected the filtering means, it will not take peaks which the difference in RT between the samples more than you entered in RT tolerance. Unless you check neither Use retention time for scoring nor Use retention time for filtering, the value of RT tolerance does not mean anything. If you didn’t select the RT filtering means the total score will be calculated and compared with the observed peak (RT score) of a lipid/metabolite in your data and the score of the peak (RT score) from a reference library.
Click on Next to proceed to the Adduct Ion Parameter Settings. In this section, you will need to select the adduct ions relevant to your analysis.
The following sections will provide detailed instructions on how to choose and configure adduct ions for your analysis (Figure 9).
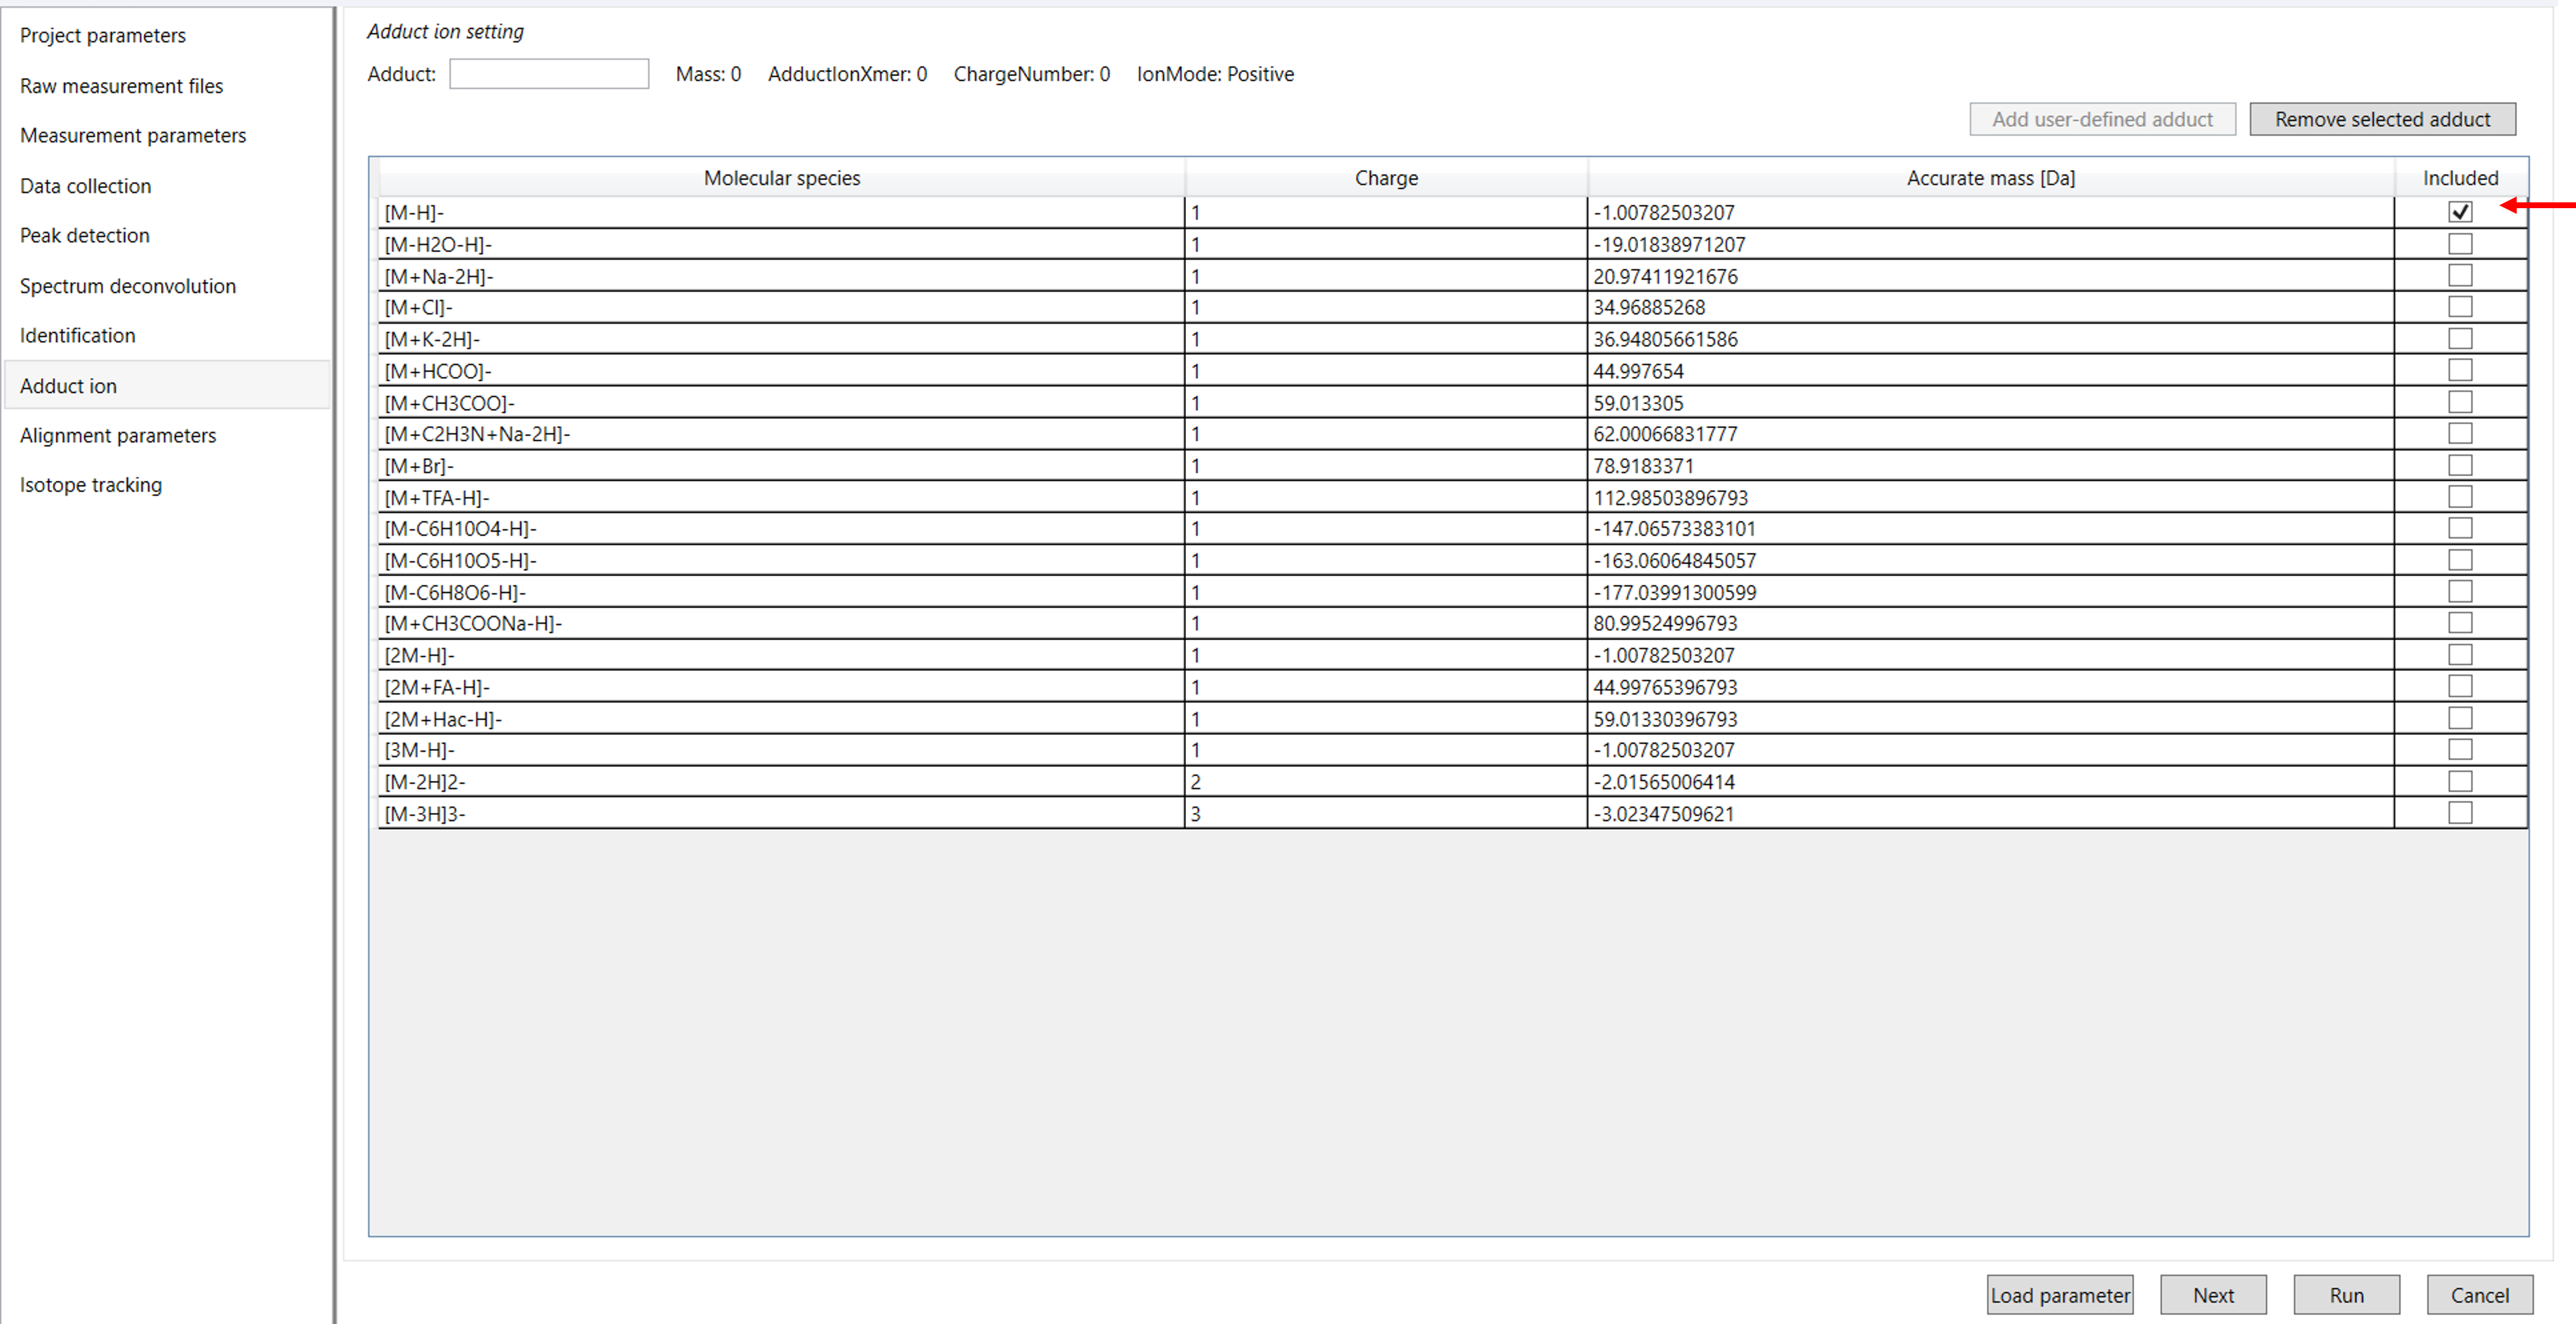
4.6 Adduct ion parameters:
Adduct ion setting: You can tick the adduct ions and charge values which is suitable for your analysis.
Adduct ion format: Adduct ion information should be formatted as described in this section: [M+Na]+, [M+2H]2+, [M-2H2O+H]+, [2M+FA-H]-, etc.
The parentheses ‘[’ and ‘]’ must be used to bracket the ion information. The char + and - are required after ‘]’ and the number must be written before + or -.
When you want to define the organic formula like C6H12O5, you have to write it without any replicate elements or parentheses like [M+C2H5COOH-H] or [M+H+(CH3)3SiOH].
The beginning figure of organic formula like ‘2’H2O is recognized as the H2O × 2. Again, do not use 2(H2O) to specify this.
Sequential equations are acceptable: [2M+H-C6H12O5+Na]2+.
MS-DIAL accepts some abbreviations or common organic formulas for adduct types as follows.
For Acetonitrile: ACN, CH3CN
For Methanol: CH3OH
For Isopropanol: IsoProp, C3H7OH
For Dimethyl sulfoxide: DMSO
For Formic acid: FA, HCOOH
For Acetic acid: Hac, CH3COOH
For Trifluoroacetic acid: TFA, CFCOOH
Click Next to proceed to the Alignment Parameter Settings. In this section, you’ll need to configure various parameters including the reference file, RT tolerance, RT factor, features based on blank information, and peak count filter for adduct ions (Figure 10).
The following sections will provide detailed instructions on how to set each of these parameters for optimal alignment of your data.
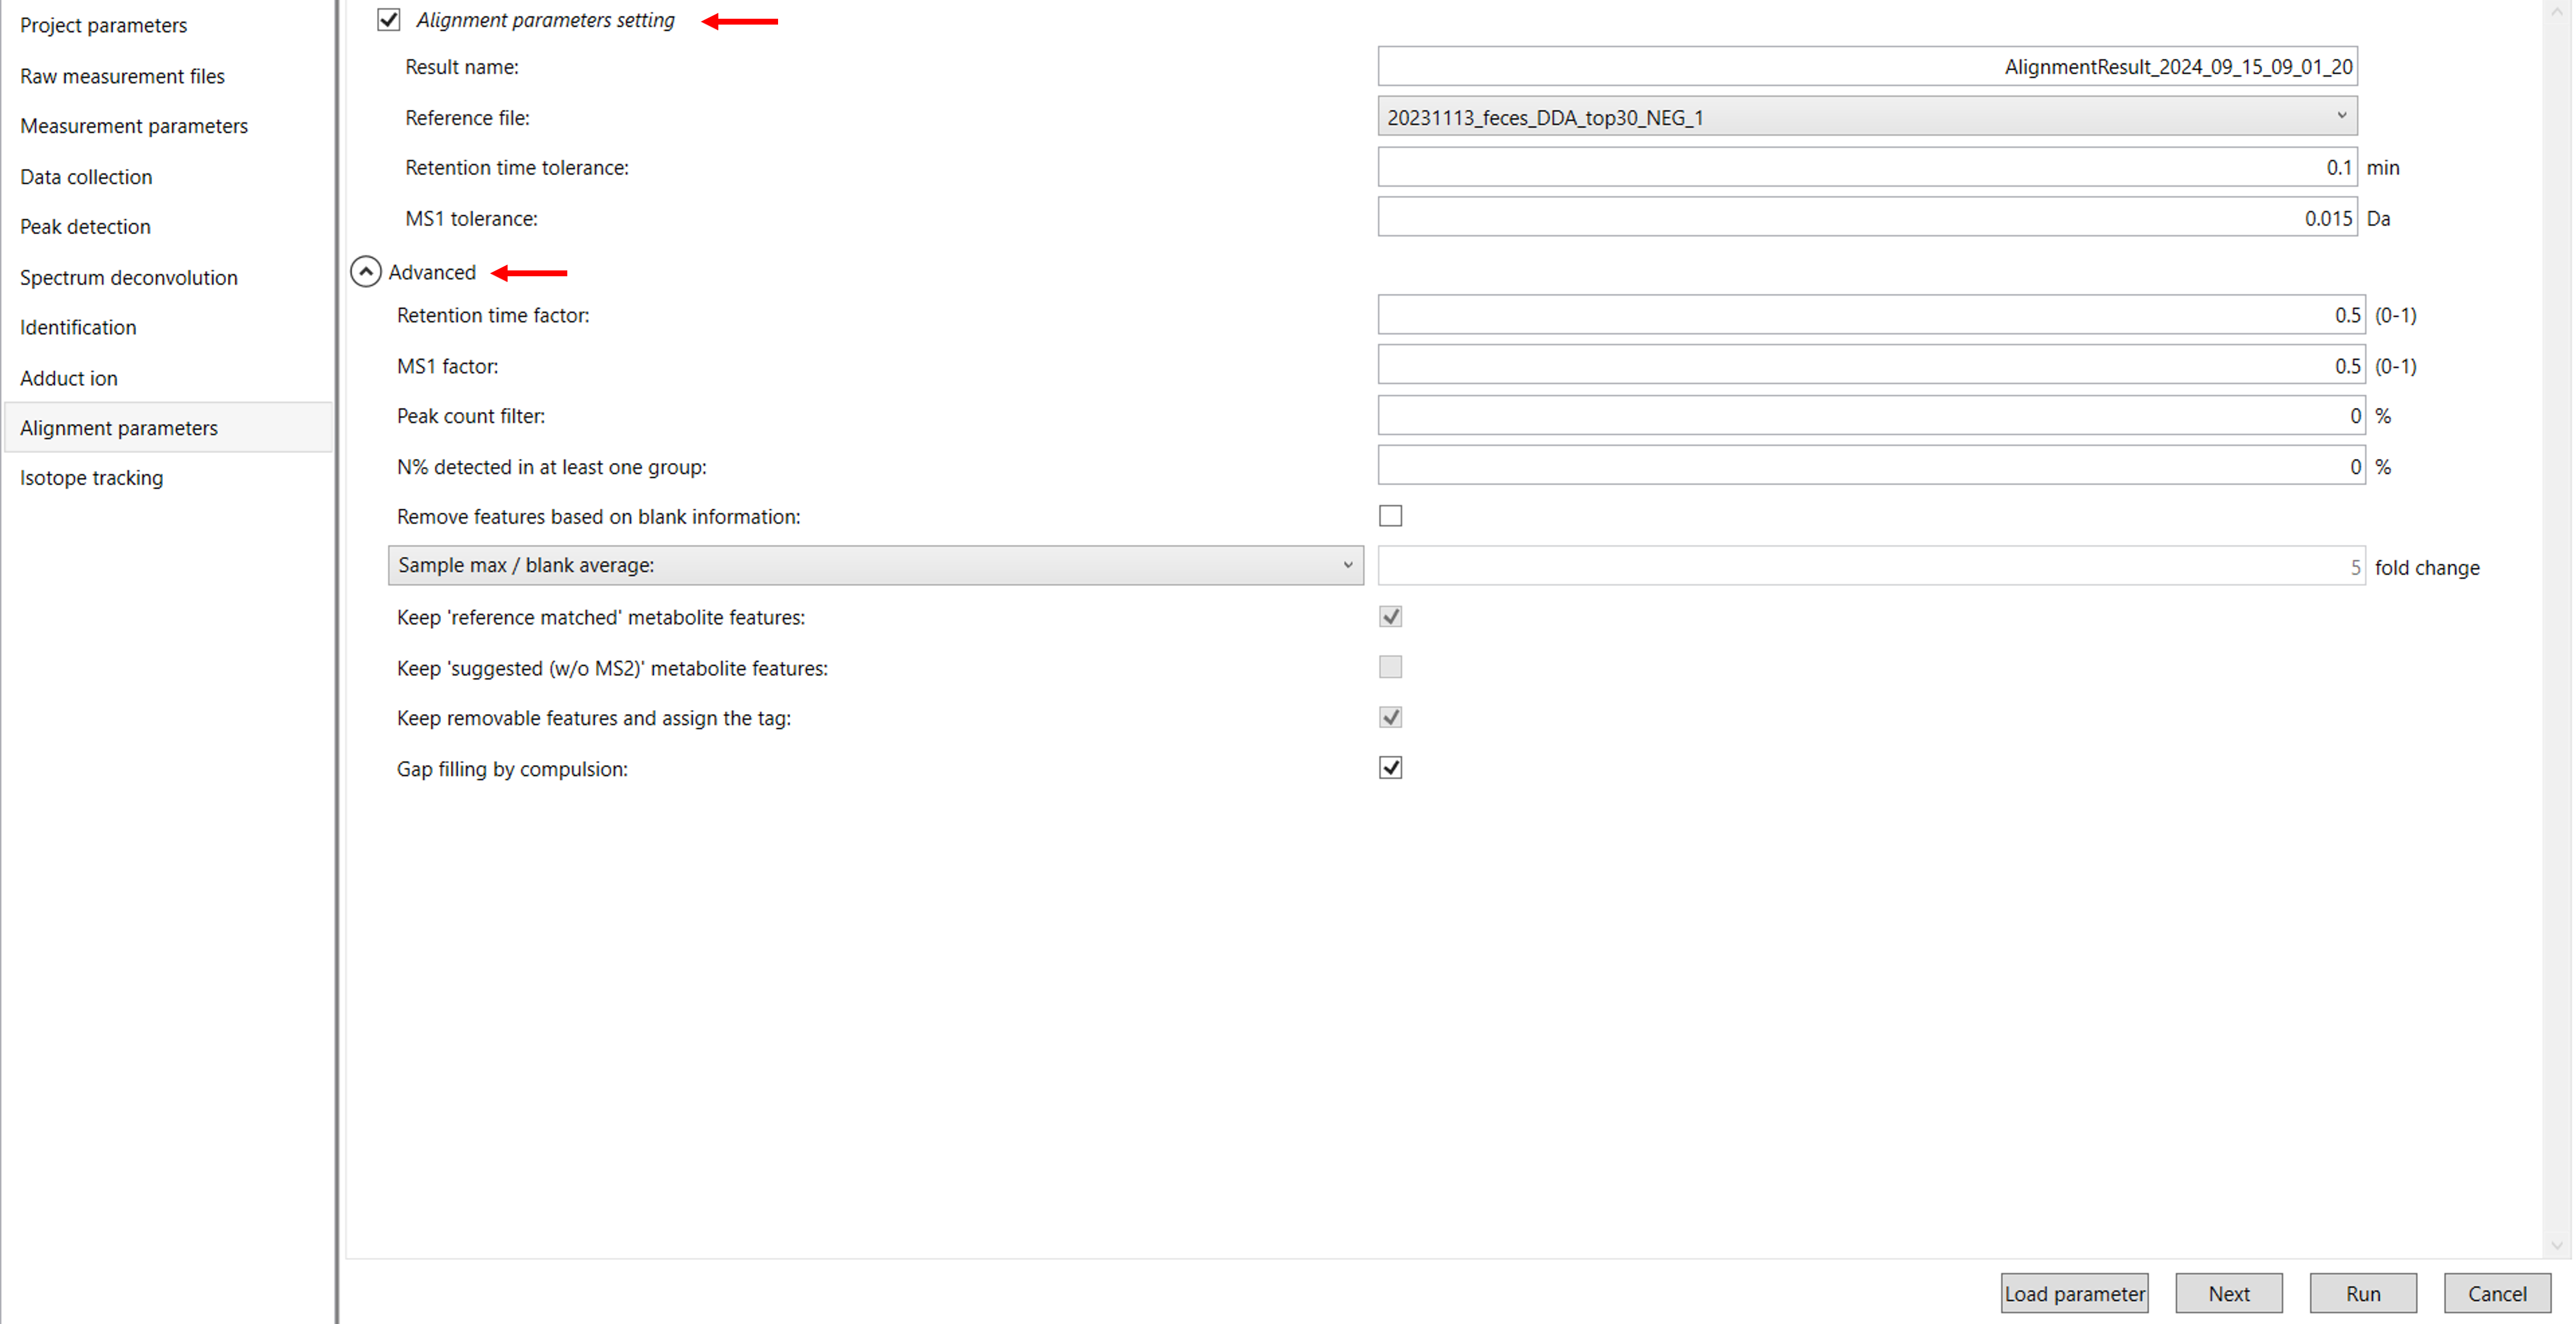
4.7 Alignment parameters:
Result name: The name will be the name of each alignment shown at the tab of ‘Alignment navigator’ in the main window.
Reference file: If you already have suitable quality control (QC) data, typically mixed sample data, then specify the QC file in the reference file. All sample data will be aligned to this QC file.
RT and MS1 tolerances: The RT and MS1 of the peak will be compared with the library RT and MS spectra. Typically, give the default setting values.
Retention time factor and MS1 factor: These values indicate the importance of either RT or MS1 to compare and evaluate the similarity of the spectra among samples based on RT and MS1 tolerance.
Equation to calculate the RT factor: =exp(-0.5*(sample1(RT)-sample2(RT))/RT tolerance)^2)
Equation to calculate the m/z factor: =exp(-0.5*(sample1(m/z)-sample2(m/z))/m/z tolerance)^2)
Peak count filter: If you want to remove specific peaks that are not fully detected in the alignment, specify the peak count filter.
For example, if you have 3 biological replicates with the same peak information and the total number of data is 24. Then, you may set the peak count filter as (3/24)∗100. This means peaks will be removed when they include missing values for more than the entered peak count filter (%). In the tutorial data we have only 3 samples.
N% detected in at least one group: The filtering is done within each sample group. If it is set to 100%, the peaks should be detected in all of the samples of a class.
Remove Features Based on Blank Information: If you include blank sample information in your analysis and want to incorporate it into the results, enable this option. This allows MS-DIAL to evaluate and filter peaks based on the blank sample data. Once this option is checked, you can also adjust the following settings:
Keep ‘Reference Matched’ Metabolite Features: This option ensures that any metabolites matched to a reference library (such as MSP or Text libraries) are retained, even if they appear in the blank sample.
Keep ‘Suggested (without MS2)’ Metabolite Features: This retains metabolites that are annotated based on their MS1 feature alone, without MS2 data, even if they exceed the blank feature threshold.
Keep Removable Features and Assign the Tag: By selecting this, any features that don’t pass the blank feature threshold will still be included in the results, but they will be marked as removable. You can review these features by using the “Blank Filter” checkbox in the Peak Spot Navigator pane. If you uncheck this option, the blank-related features will be fully removed from the analysis, and you will no longer be able to view them after alignment. In our data, we are using the default option set by tool.
Gap Filling by Compulsion: This enables to recognition of peaks based on the average peak width of detected metabolites across samples, even if a local maximum isn’t observed in the chromatogram.
Click Next to proceed to the Isotope Tracking Settings. In this section, you will configure the settings to enable isotope tracking in your data (Figure 11).
The following sections will provide detailed instructions on how to set up the isotope tracking parameters for your analysis.
4.8 Isotope tracking parameter:
Tracking of isotope labels: If you check this box, it will identify and monitor the isotopically labeled lipids or metabolites in your sample. This is especially useful in lipidomics or metabolomics experiments where stable isotopes like 13C or 2H are incorporated into lipids or metabolites in your study.
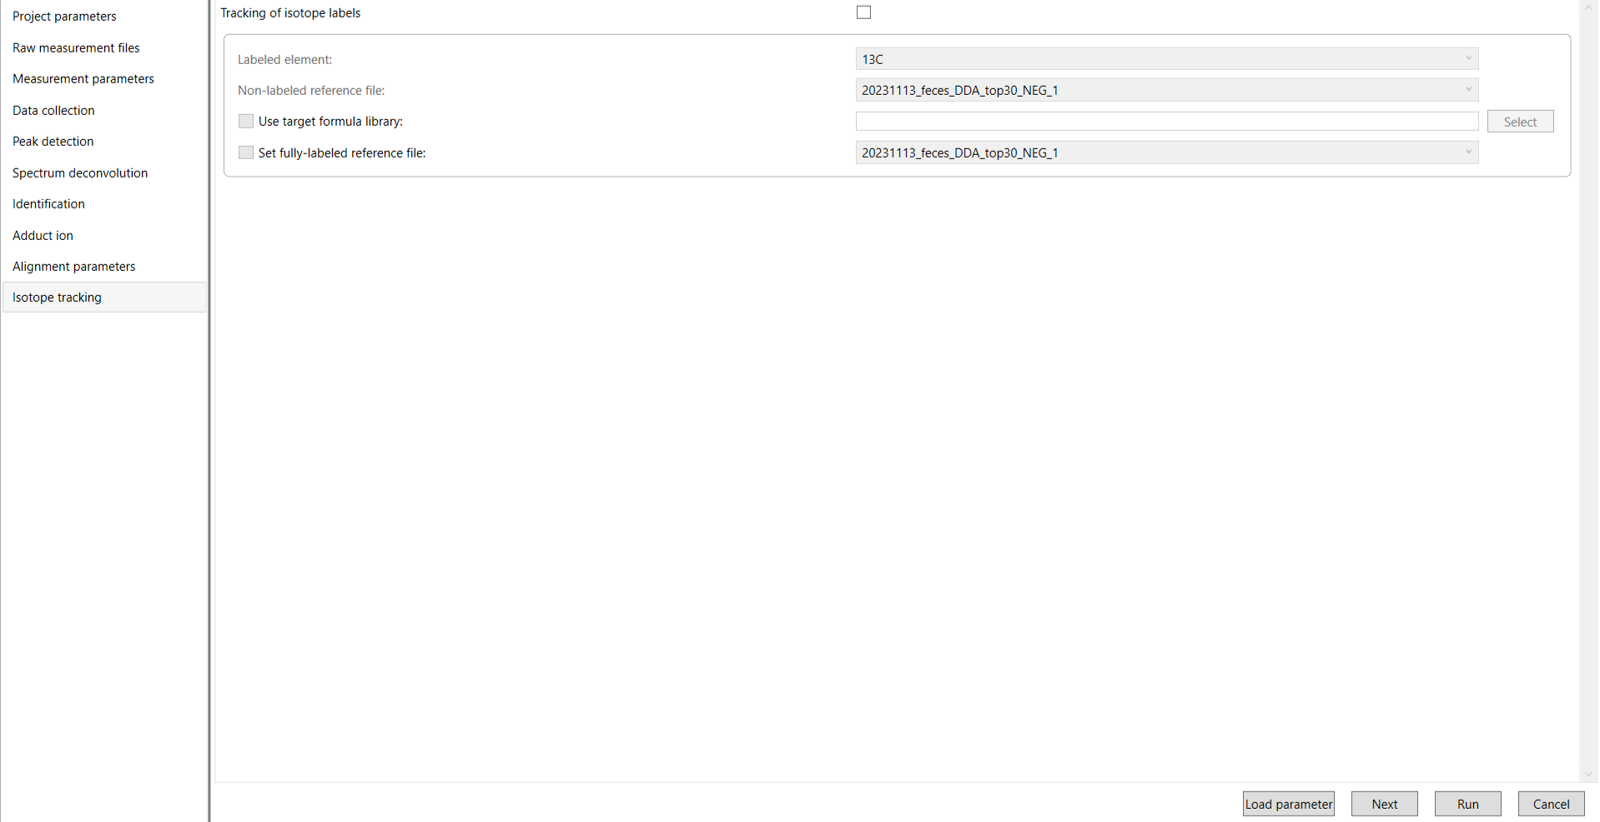
Then you can click Run for the processing of your MS data in MS-Dial 5 and click Save to save the project.
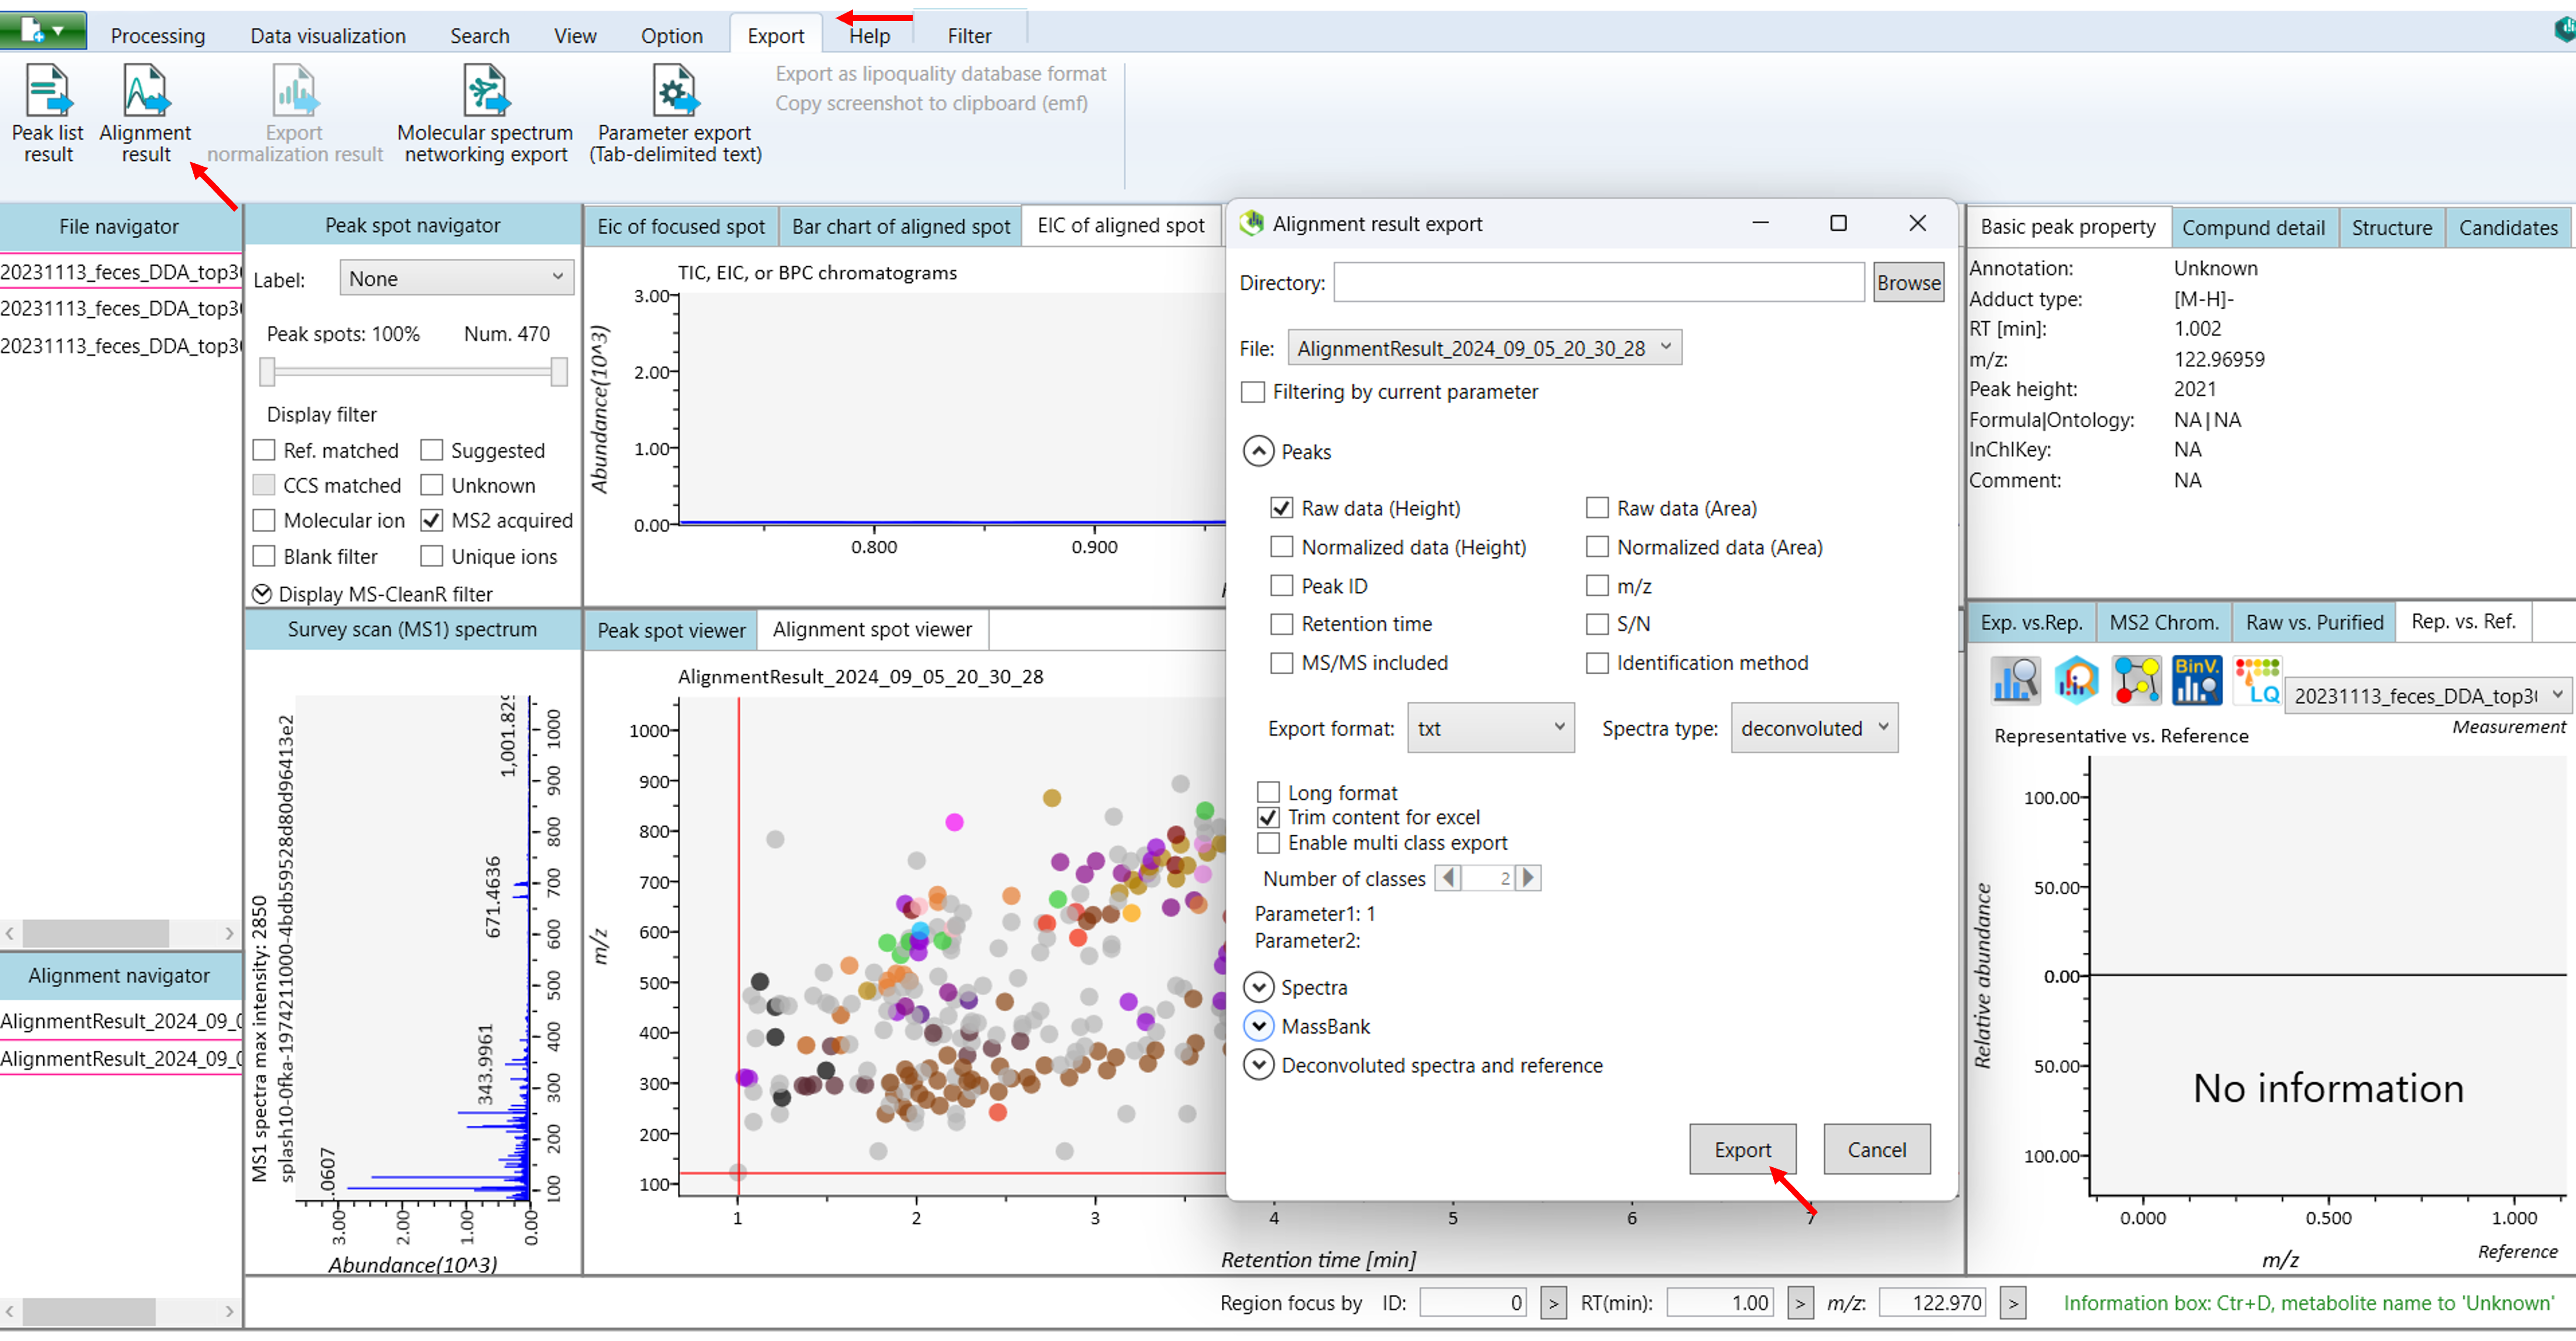
Once you finished the data processing like peak picking, peak identification, and peak annotation. You can click the export icon to export the results in different forms (Figure 12).
The following sections will provide detailed instructions on how to export your results.
4.9 Export:
Here, in this case, we are using the alignment results export option to get all the spectral information of lipids.
The following options are used to export the results:
Peak list export: You can get the peak list information of each sample including retention time, m/z, MS/MS spectra information, and so on. Available formats are MSP, MGF, or Text.
Alignment result export: You can get the results of your data especially spectral information of lipids or metabolites. To export alignment results you just need to choose an export folder path and choose an alignment file that you want to export. Select export format if you want to export the representative spectra. Then click the export button.
Molecular spectrum networking export: You can obtain results that show the relationships between molecular features based on their fragmentation patterns.
Copy screenshot to clipboard (emf): By copying a screenshot to the clipboard in EMF format, you get a vector-based image that retains high quality when resized.
Parameter export (Tab-delimited text): By exporting parameters as a tab-delimited text file, you get a structured file containing the settings and parameters used during your analysis. This format makes it easy to review, share, or import the parameters into other tools.
Understanding “Fill%” and “S/N Average” in Mass Spectrometry data
Let’s consider for lipidomics project:
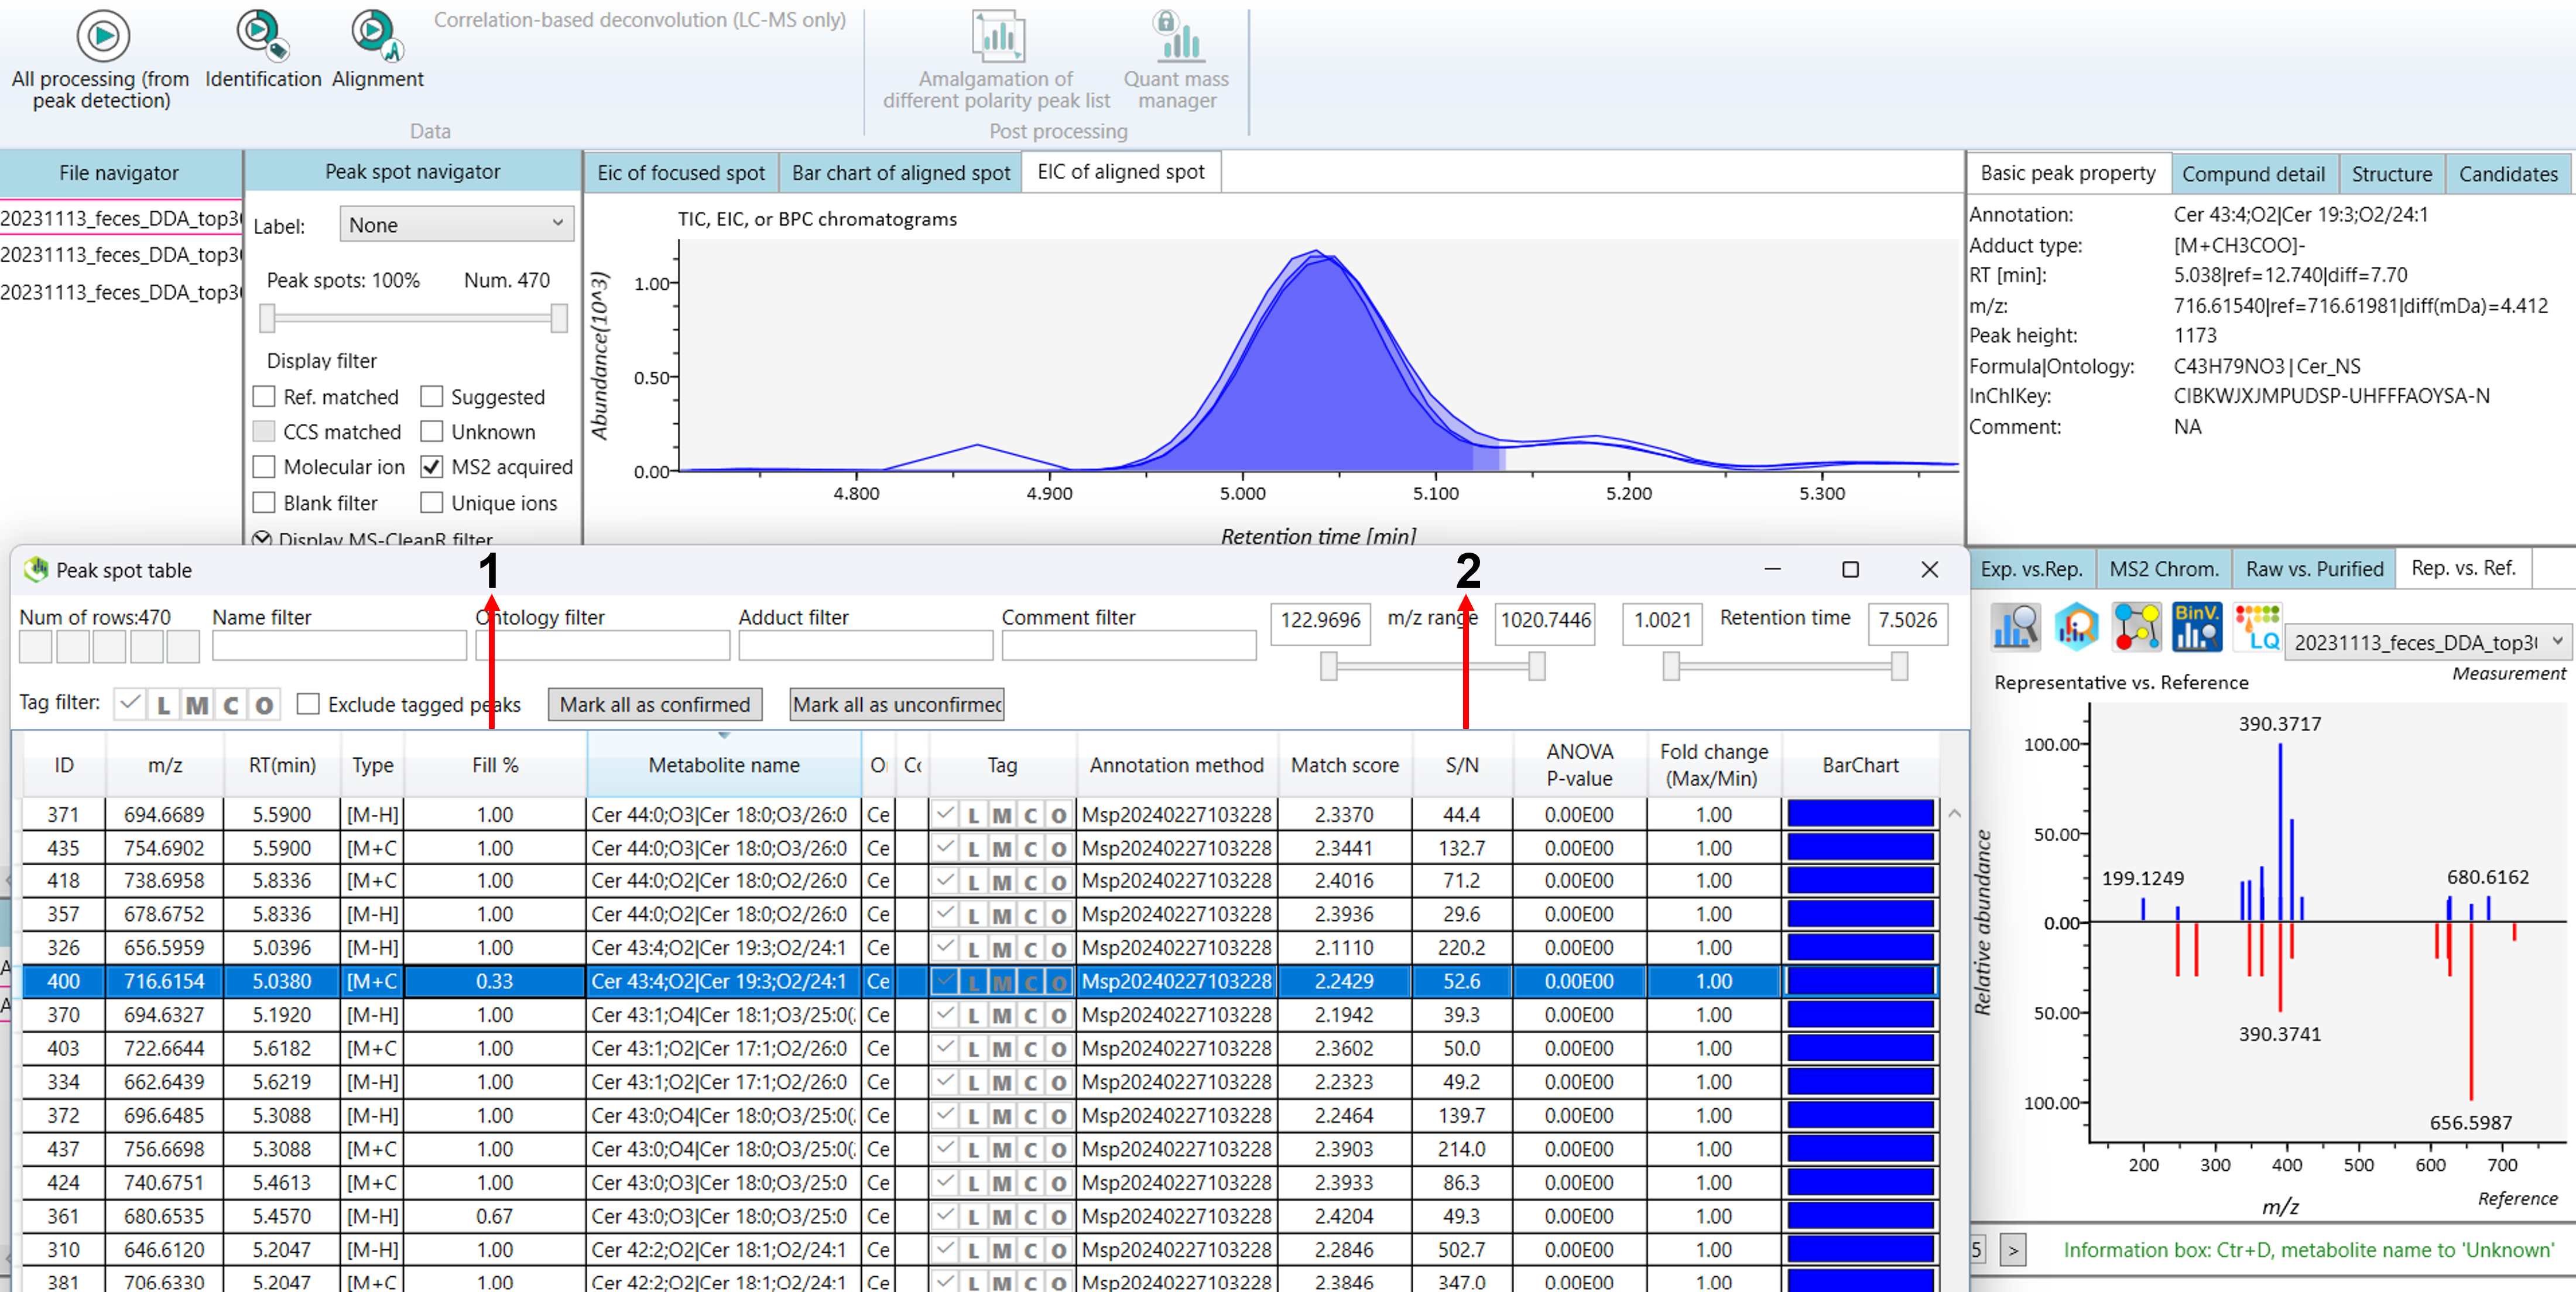
1: Meaning of Fill%:
Fill% refers to the proportion of scans or runs in which a particular ion or feature is detected during mass spectrometry analysis. It indicates how consistently the feature is present across multiple injections or samples (Figure 13A).
Fill% helps assess the reliability of detection for a particular compound in a sample, indicating how frequently it was detected during analysis.
2: Meaning of S/N average:
S/N (Signal-to-Noise) Average refers to the average ratio of the signal’s intensity (the compound of interest) to the background noise over multiple scans. A higher S/N ratio indicates a clearer signal against background noise (Figure 13B).
A higher S/N ratio means that the signal is clearly distinguishable from the noise, indicating reliable detection of the compound.
Low S/N ratios might indicate that the compound is difficult to detect due to high background noise, which could make identification and quantification less reliable.