Determining optimal minimum peak height
Importance of determining the optimal minimum peak height in mass spectrometry data
In mass spectrometry (MS) data analysis, particularly in lipidomics, setting an optimal minimum peak height threshold is crucial for filtering out background noise and retaining relevant peaks. The correct threshold ensures that only significant peaks, corresponding to real compounds, are captured, improving the overall accuracy and quality of your analysis.
Purpose of determining optimal minimum peak height
Determining the optimal minimum peak height threshold by using the Rawdataviewer tool. Users can understand how to set this threshold correctly, and also filter out the noise, and retain only the most relevant peaks in their MS data. This ensures cleaner, more accurate results in metabolomics and lipidomics analysis.
Step by Step workflow on how to determine optimal minimum peak height using Rawdataviewer tool
This tutorial will helps the users to determine the optimal minimum peak height in their MS data by using Rawdataviewer. The tutorial will help you interpret peak height data effectively, adjust parameters, and apply the optimal threshold to improve data quality and analysis outcomes.
How to determine optimal minimum peak height?
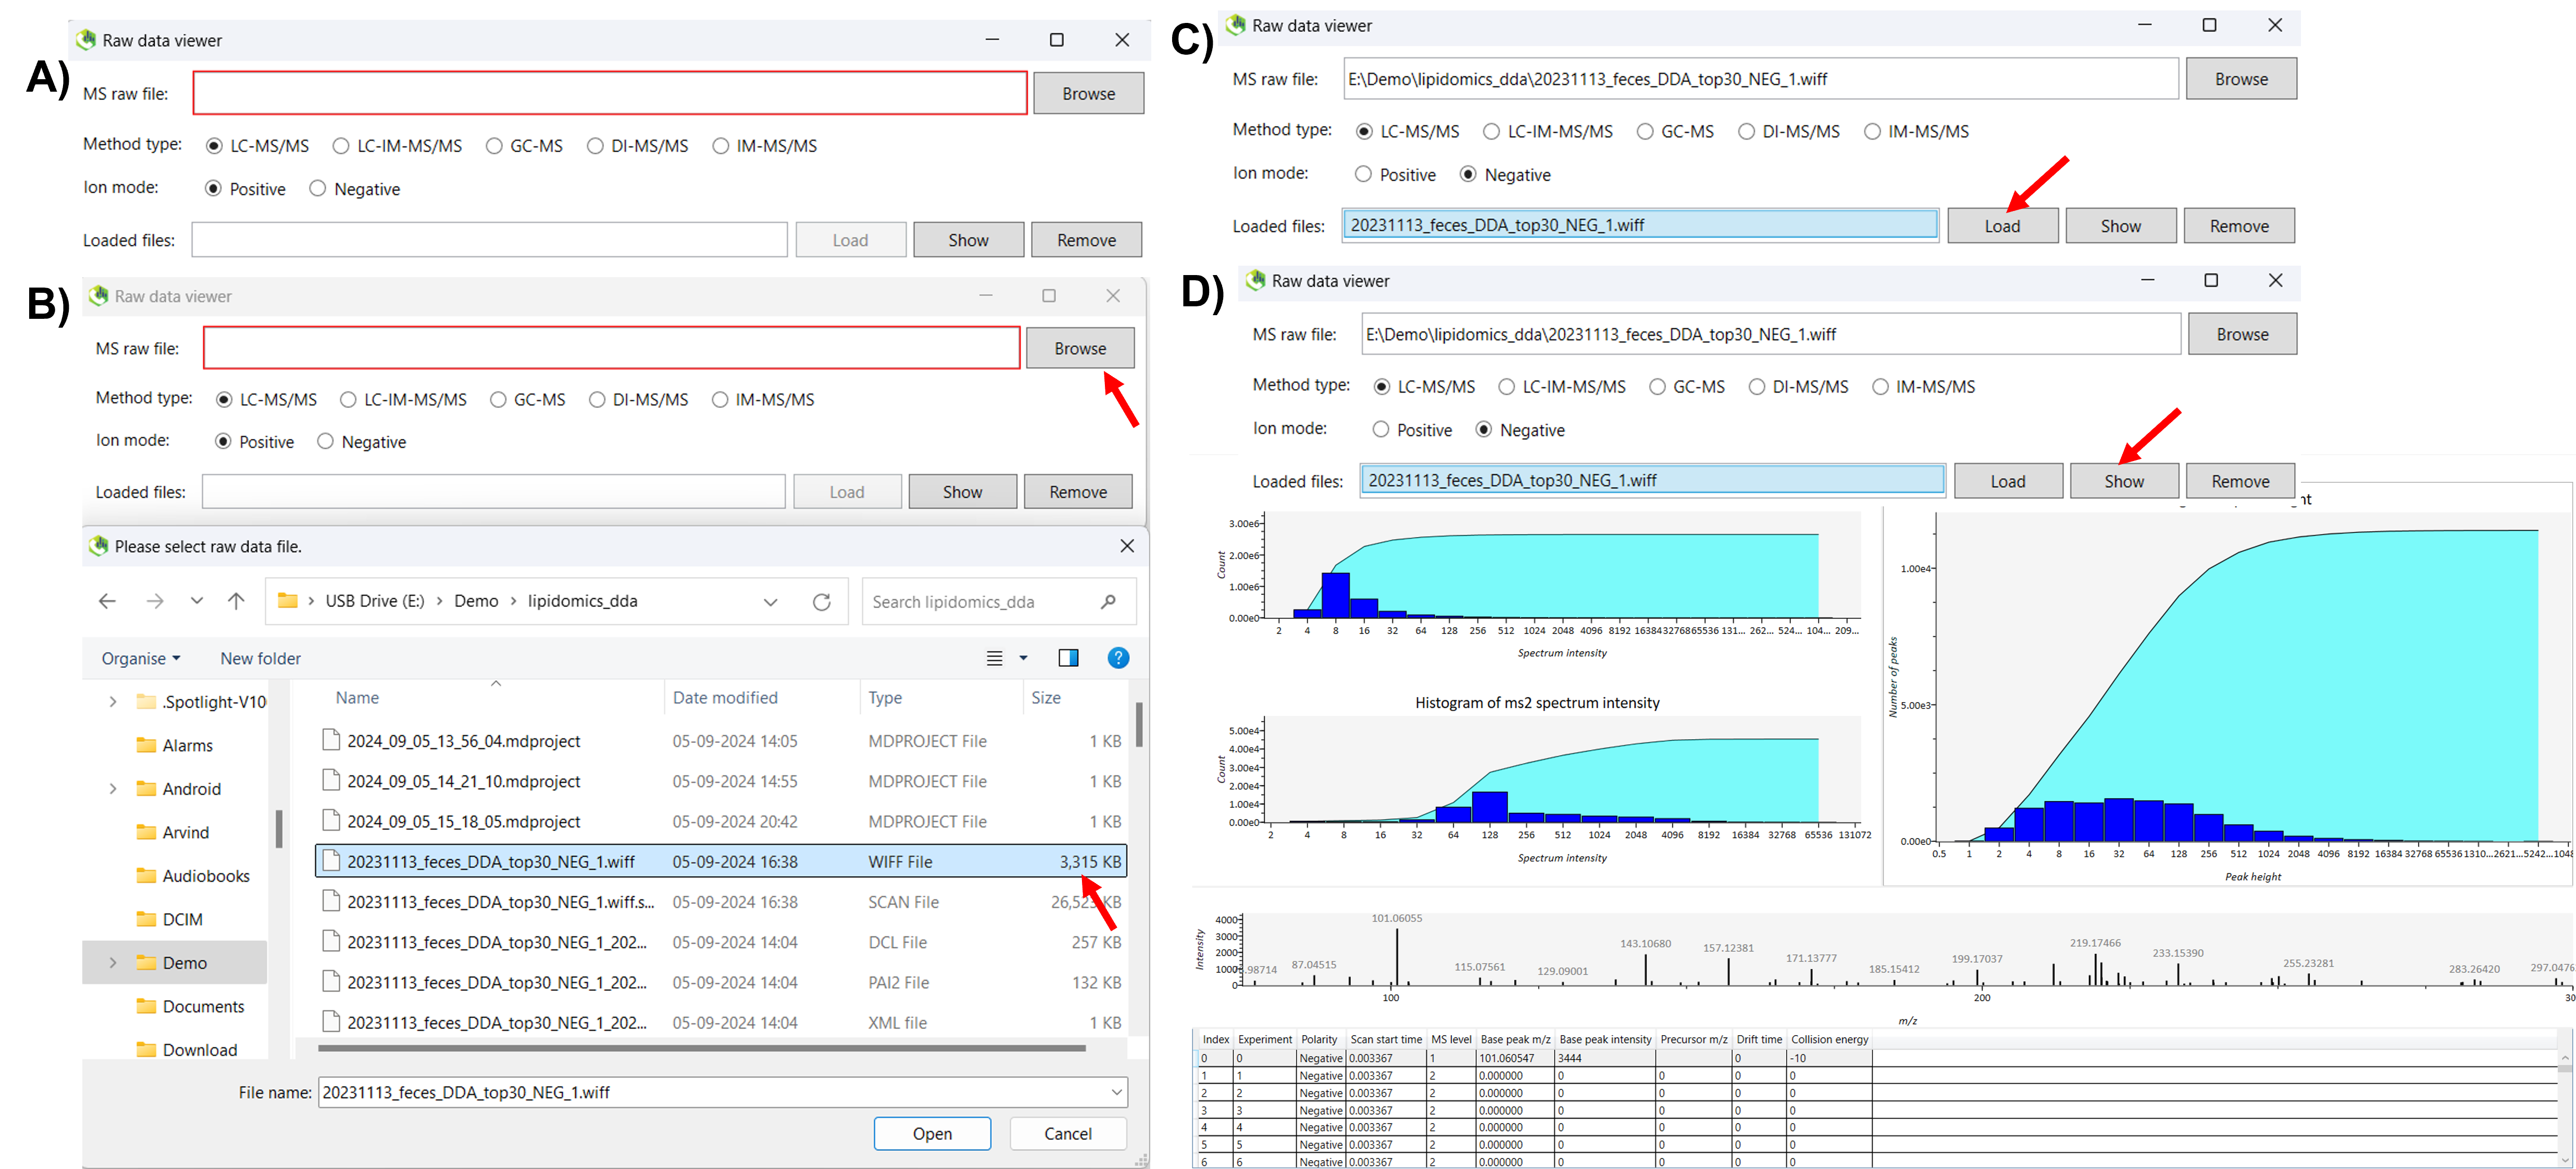
In the RawDataViewer tool, click on browse and select any raw file to determine the optimal minimum peak height, and click open. Once the file is loaded into the software, go to the method type section and choose the appropriate method based on your analysis. Select the Ion Mode (positive or negative) to match your sample. After configuring these settings, click Load to upload the file. Once the file is loaded, select the file and click the show button to display the data. Once you click the show button, a new window will appear displaying a histogram of peak height, MS, and MS/MS peak intensity information. This window also provides a table with details such as scan start time, polarity, MS levels, base peak m/z, and base peak intensity for each metabolite in your sample (Figure 1).
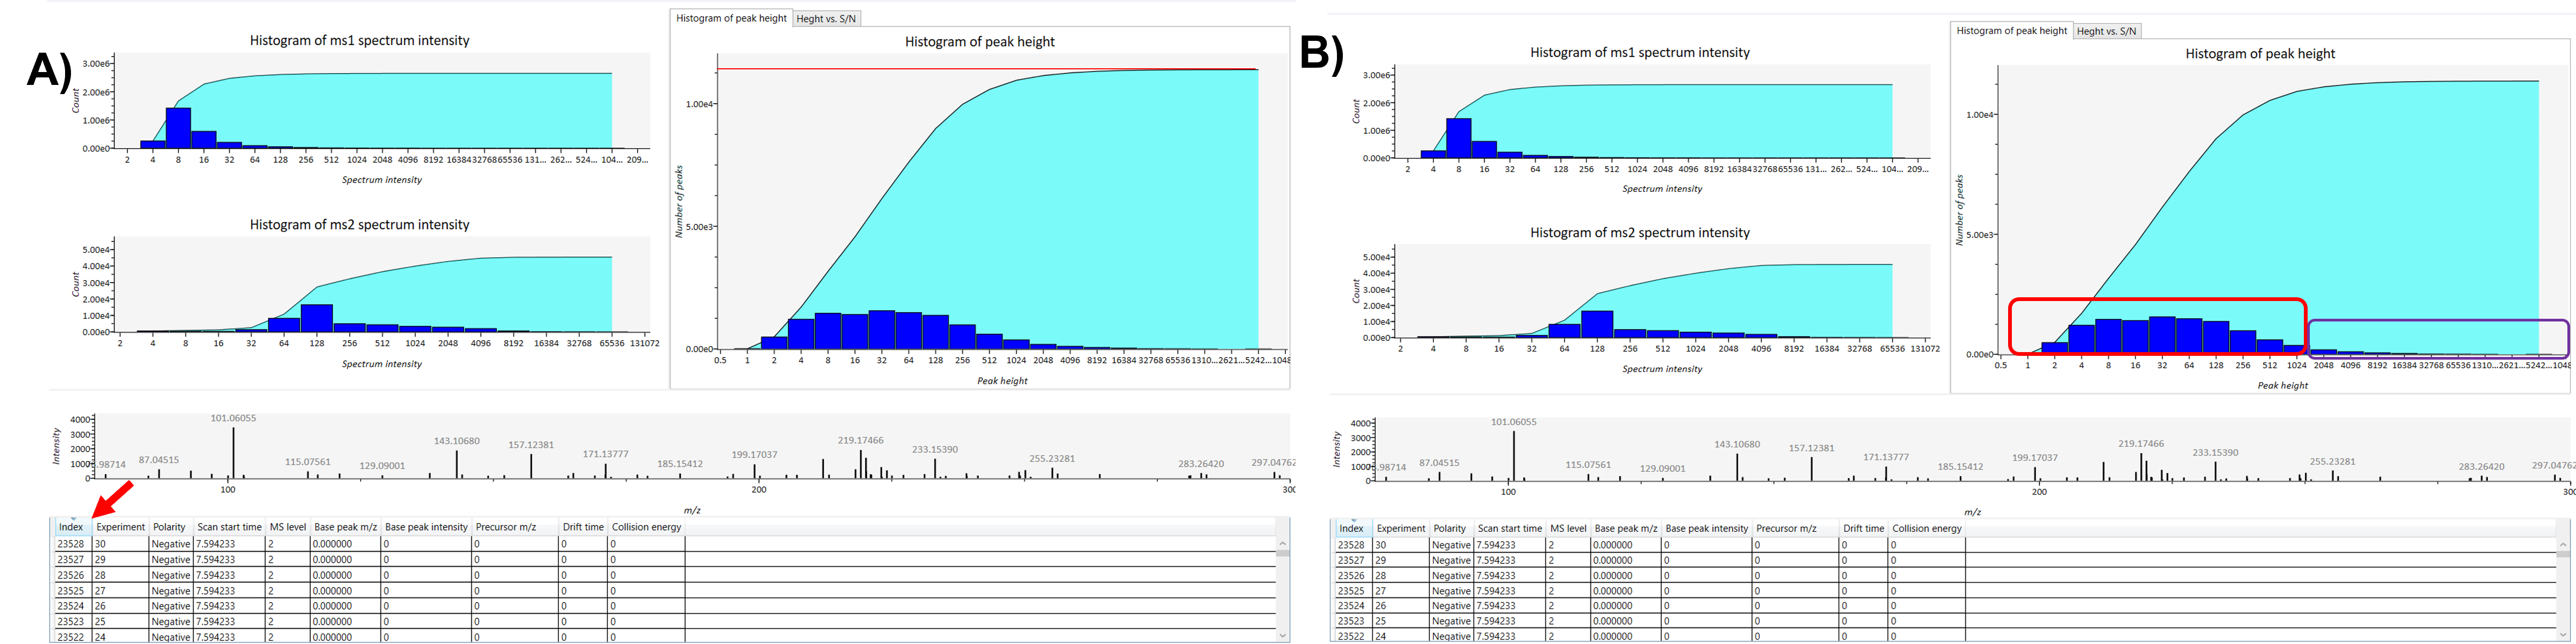
Next, check the number of peaks in the histogram of peak height. This histogram displays the number of peaks within specified height ranges, with each column bar representing the count of peaks at different heights. Then click on the index column in the table to check the number of peaks present in the raw data. Typically, in metabolomics/lipidomics studies, a reasonable number of peaks falls between 3000 ~ 5000 peaks. The histogram graph illustrates how peaks are distributed across different peak height cut-offs, helping you identify the transition from noise to meaningful peaks. Peaks on the left side of the graph, often highlighted in red, generally represent noise associated with a lower peak threshold. In contrast, peaks on the right side, highlighted in purple, are more reliable and correspond to a higher threshold. It depends on what kind of instrument you are using and how many peaks users want to analyze in their data. If they select a lower peak height threshold it will include more peaks but may also capture more noise peaks, while a higher peak height threshold will reduce noise peaks and highlight more relevant peaks. A number of peaks in each peak height cut-off point can be seen. By carefully selecting the optimal minimum peak height threshold based on the histogram analysis, you can achieve a balance between retaining significant data and reducing noise, thereby improving the quality of your analysis (Figure 2).