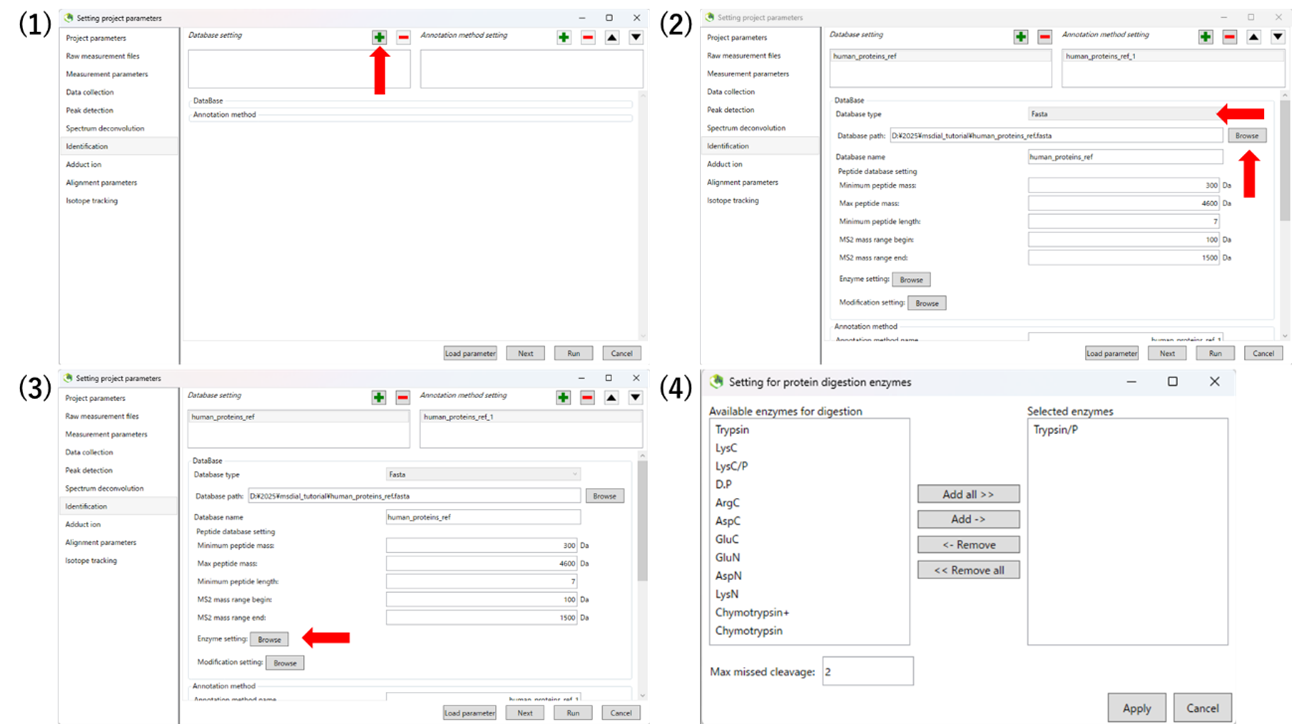
Proteomics

See Figure 2 for the meanings of the abbreviations used in this chapter.

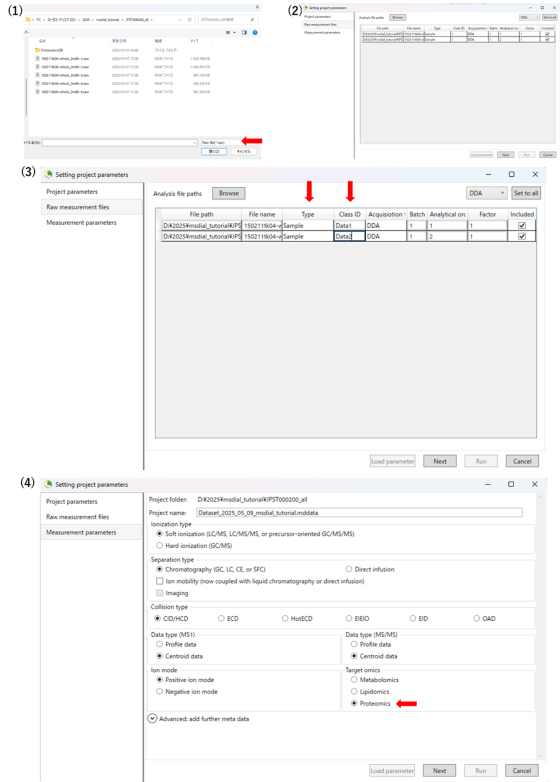
1. LC-MS (DDA) for proteomics

1-1 Input data

The dataset for reproducing this tutorial can be obtained from DOI
This tutorial utilizes 2 raw data files (*.raw) from https://repository.jpostdb.org/entry/JPST000200.
The human_proteins_ref.fasta was obtained from https://www.uniprot.org/.

1-2 Starting up your project

Figure 1: Starting up a project in MS-DIAL5. First, open the MSDIAL.exe file in the downloaded folder (1). Click on “New project” (2). You can name your project according to your preferences. Browse to the location of your experimental files. Click next and then continue to the second left side bar “Raw measurement files”. Here, click browse to access your raw data files.

Figure 2: Importing raw data files and setting up the measurement parameters. Change the type of file according to your vendor format and select the raw data files that you want to import (1). After improting your raw data files, you will be able to further assign identifiers to your measurements by sample “Type” (Sample, Standard, Blank), “Class ID” (according to your experimental setup) set the batch, analytical order, dilution factor, or possibly exclude some samples from further data processing (2, 3). This is because to be able to use all MS-DIAL functions. After clicking next and selecting the “Measurement parameters” in the left side tab, you can specify your analytical setup according to this figure (4).

Figure 3: Setting other project parameters according to your thoughts. Specifically, in the “Identification” section, FASTA files obtained from Uniprot or other sources can be set as a database. Select the “+” next to “Database setting” (1). Here, select the database type and browse to access your files (Fasta) (2). In addition to this, if you browse the enzyme setting, you can select the enzyme according to your experimental setup (3, 4). Also, you can set modification settings in this entry. In the proteomics mode of MS-DIAL, carbamidomethyl (CAM) of cysteine is considered in the default settings.

Figure 4: This is the main view of MS-DIAL. Double-clicking on a file name in the file navigator will display the detected peak information in the center window (Peak spot viewer) (1). “Show ion table” window can be displayed both on the alignment result viewer and the peak spot viewer (2). Based on the amino acid sequence information in the Fasta file, the sequence is annotated and mapped as a peptide that is expected to be generated when digested with trypsin, etc. (3). The peak height is visualized in a bar chart for each result. Each peptide result can be marked with a Comment or Tag (4). This result should be retained by saving the project file (5). The annotation of each peptide involves analysis of its tandem mass spectrum. Assuming peptide bond cleavage induced by Collision Induced Dissociation (CID), lists of b-ions and y-ions derived from each peptide sequence are generated and compared. In MS-DIAL, product ions with charges greater than one are also considered. B-ions are displayed in red and y-ions in cyan, shown as paired spectra below the measured spectrum (6).

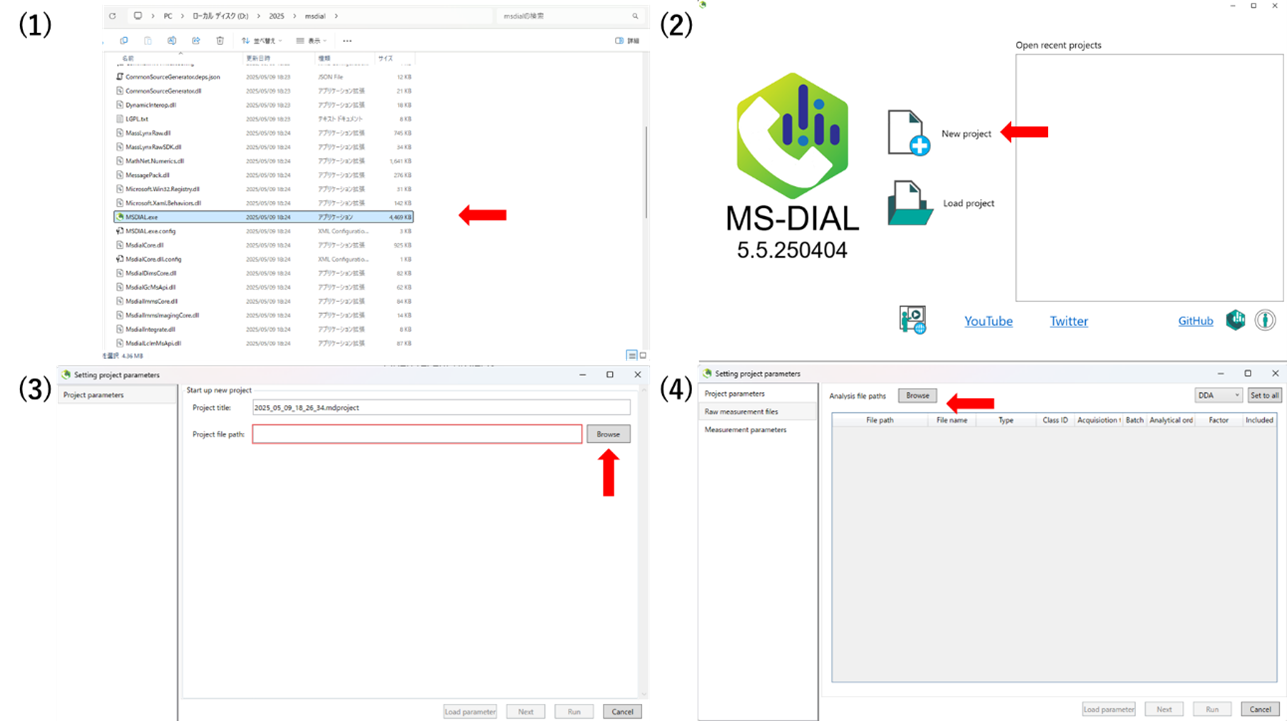
The video tutorial for the MS-DAIL5 operation