Determining Mass Spectrometry (MS) Data Types in MS-Dial: Centroid or Profile
Importance of selecting centroid or profile data formats in MS-DIAL
In mass spectrometry (MS) data processing, particularly in complex analyses like untargeted lipidomics or metabolomics, the choice between centroid and profile data formats plays a crucial role in the accuracy and effectiveness of your analysis. This distinction is important because each data type requires specific settings in MS-DIAL software to ensure accurate peak detection, quantification, and downstream analysis. MS-DIAL is a powerful software tool that supports both types of data, and understanding how to select the appropriate one for your analysis can significantly impact lipidomics or metabolomics your results.
What are Centroid and Profile Data?
Centroid Data: Centroid data represents mass spectrometry peaks as discrete points at their central m/z values. Each peak is summarized by a single intensity value located at its centroid, which is the peak’s most significant point. This format simplifies the data by reducing noise and focusing on the peak’s central information, making it easier to process and analyze large datasets.
Profile Data: Profile data provides a detailed view of the entire peak shape in a mass spectrum by showing continuous intensity values across a range of m/z values. Profile data captures the full profile of each peak, including its shape and width, allowing for a comprehensive representation of the peak’s characteristics.
Why selecting an MS (Centroid or profile) data type is important?
Selecting between centroid and profile data formats is crucial because it directly impacts the accuracy and effectiveness of data analysis in mass spectrometry. Profile data provides a detailed representation of each peak’s shape and width, capturing continuous intensity values across a range of m/z values. This detailed information is essential for resolving closely spaced or overlapping peaks, particularly when analyzing complex samples with isomers or other closely related compounds. In contrast, centroid data simplifies each peak to a single point at its central m/z value, reducing noise and processing time but potentially losing important details about peak shapes. This can lead to challenges in distinguishing between overlapping peaks or accurately quantifying compounds. Therefore, choosing the correct data format ensures that the analysis is optimized for the complexity of the sample, allowing for more precise identification and quantification of compounds.
Step by Step workflow on how to determine MS (Centroid or profile) type in MS-Dial
The purpose of this tutorial is to help the users to identify whether their mass spectrometry (MS) data is in centroid or profile mode. Identifying the correct data type is essential, as each requires different processing settings in MS-DIAL, which directly impacts the accuracy and reliability of the analysis. Ensuring that the MS data type is properly identified and allows MS-DIAL to be configured correctly, resulting in precise peak detection and accurate quantification.
Determining the type of MS data takes only a few steps. First, download the latest version of MS-DIAL 5.3. The file will be downloaded in ZIP format, so please extract all the files in the ZIP folder to a specific location on your computer. Once extracted, locate and open the RawDataViewer.exe application. This tool will allow you to identify whether your data is in centroid or profile mode.
How to determine centroid data?
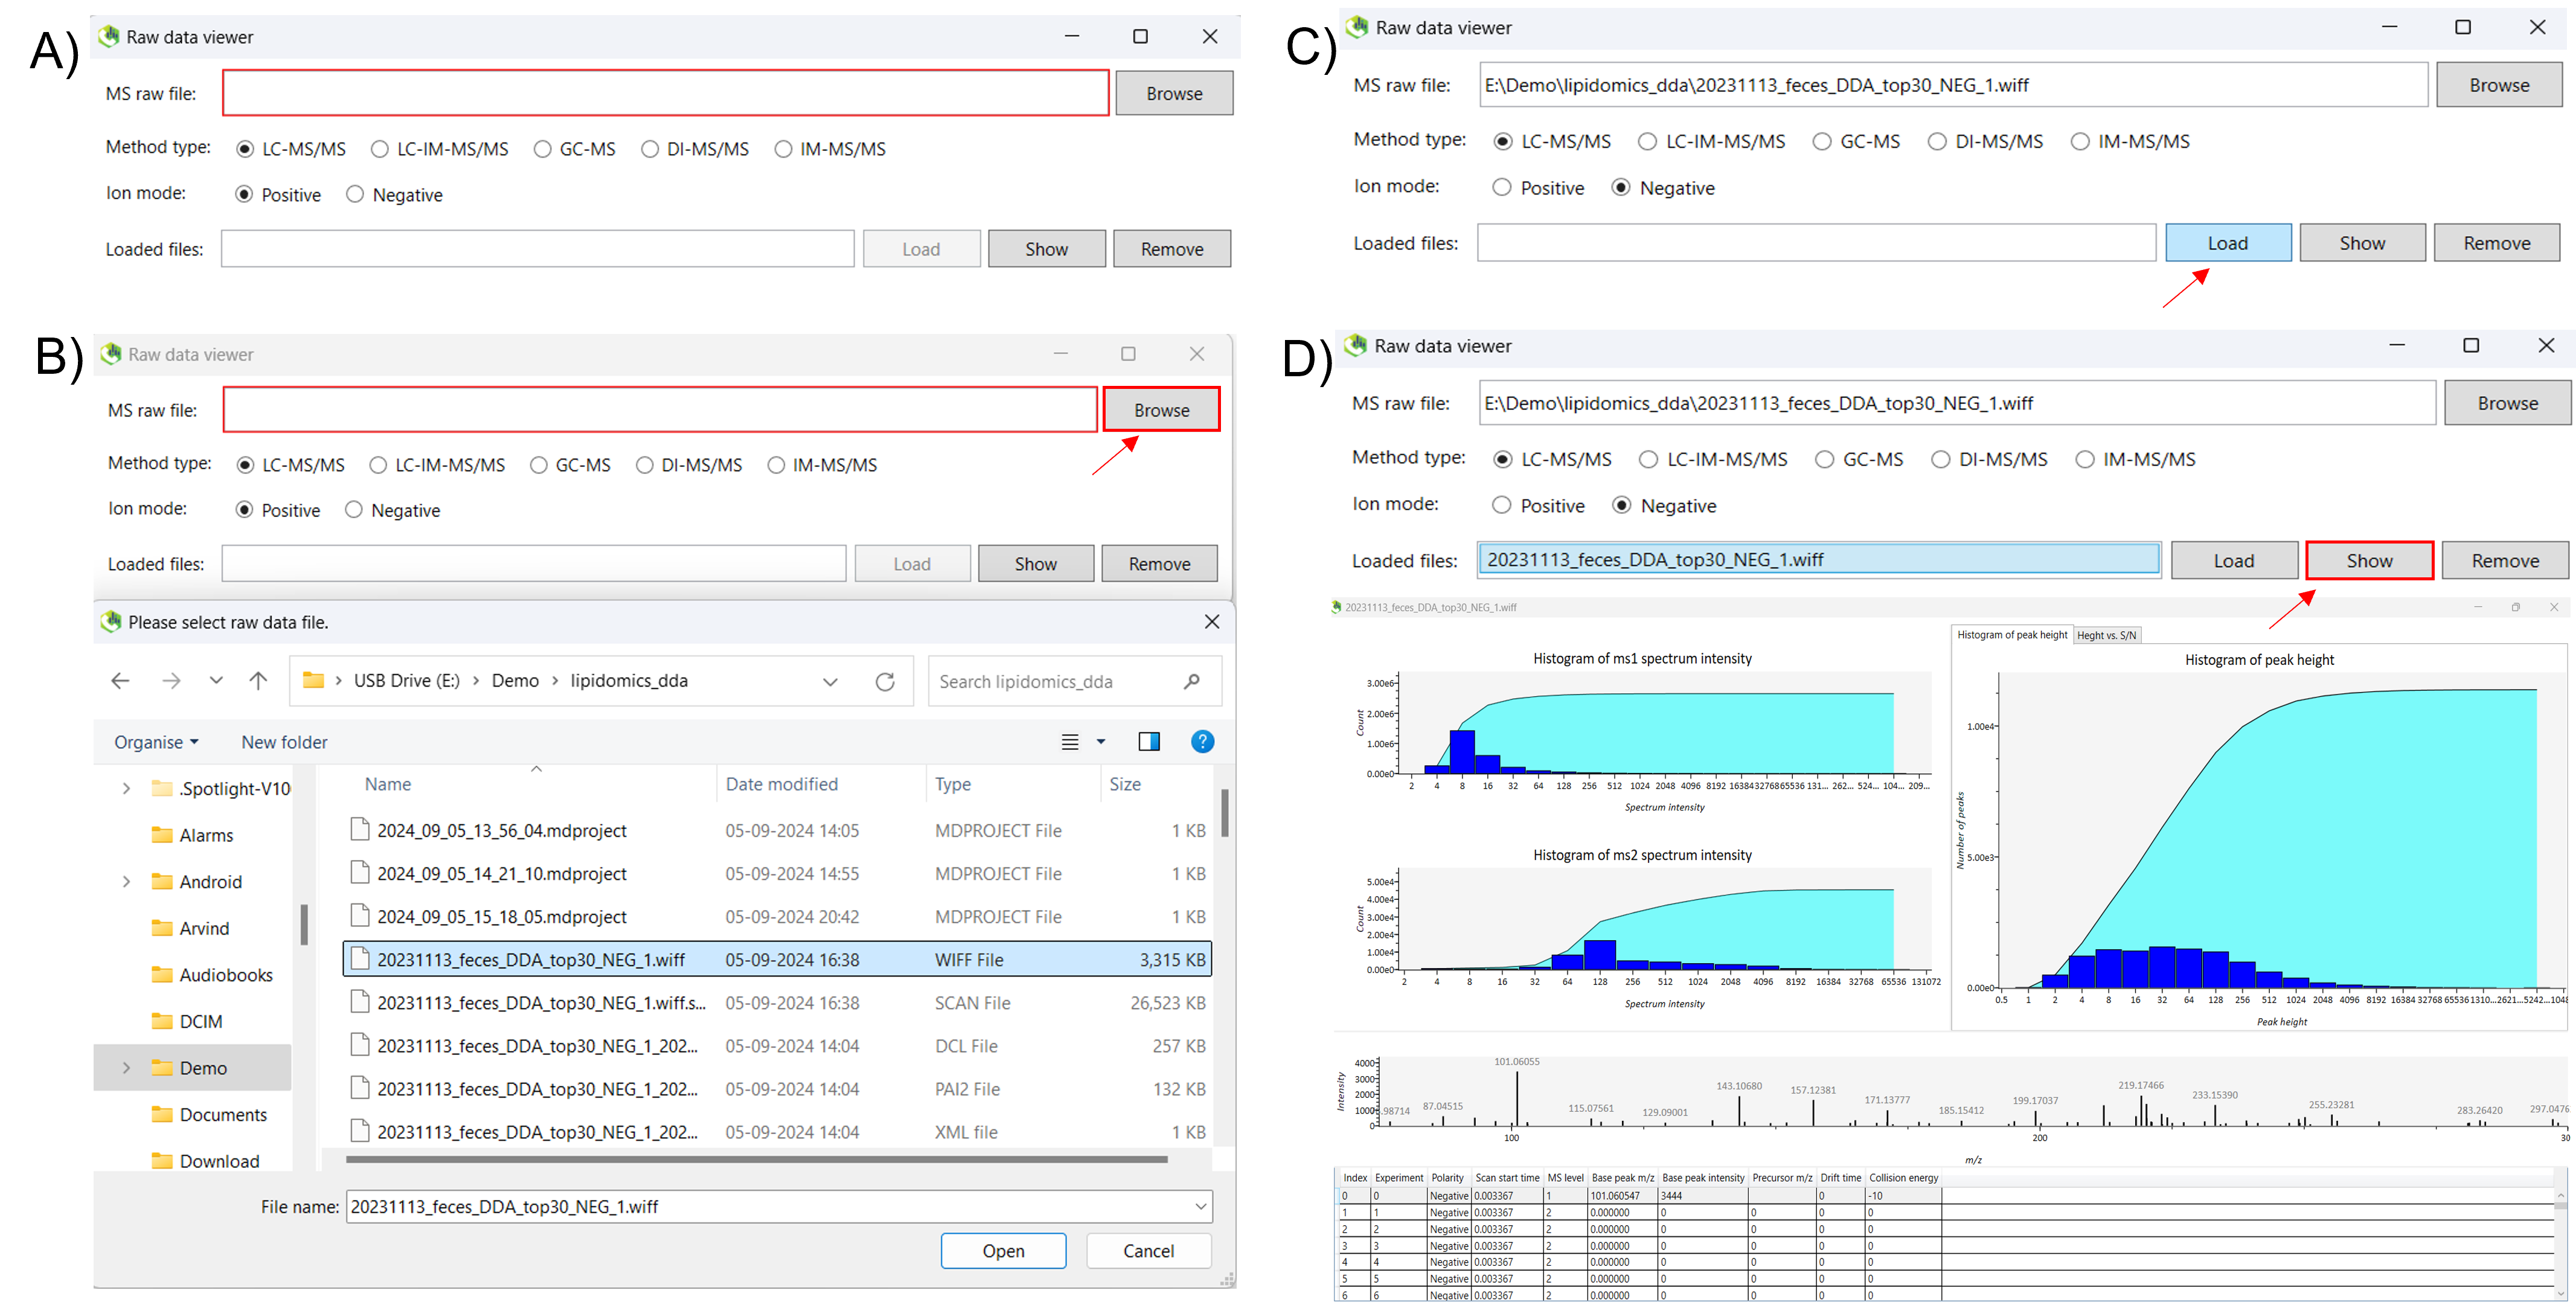
In the RawDataViewer tool, click on browse and select any raw file to check whether the MS data is centroid or profile and click open. Once the file is loaded into the software. In the Method Type section, choose the appropriate method based on your analysis, and select the Ion Mode (positive or negative) to match your sample. After configuring these settings, click Load to upload the file. Once the file is loaded, select the file and click the show button to display the data. Once you click the show button, a new window will appear displaying a histogram of peak height, MS, and MS/MS peak intensity information. This window also provides a table with details such as scan start time, polarity, MS levels, base peak m/z, and base peak intensity for each metabolite in your sample (Figure 1).
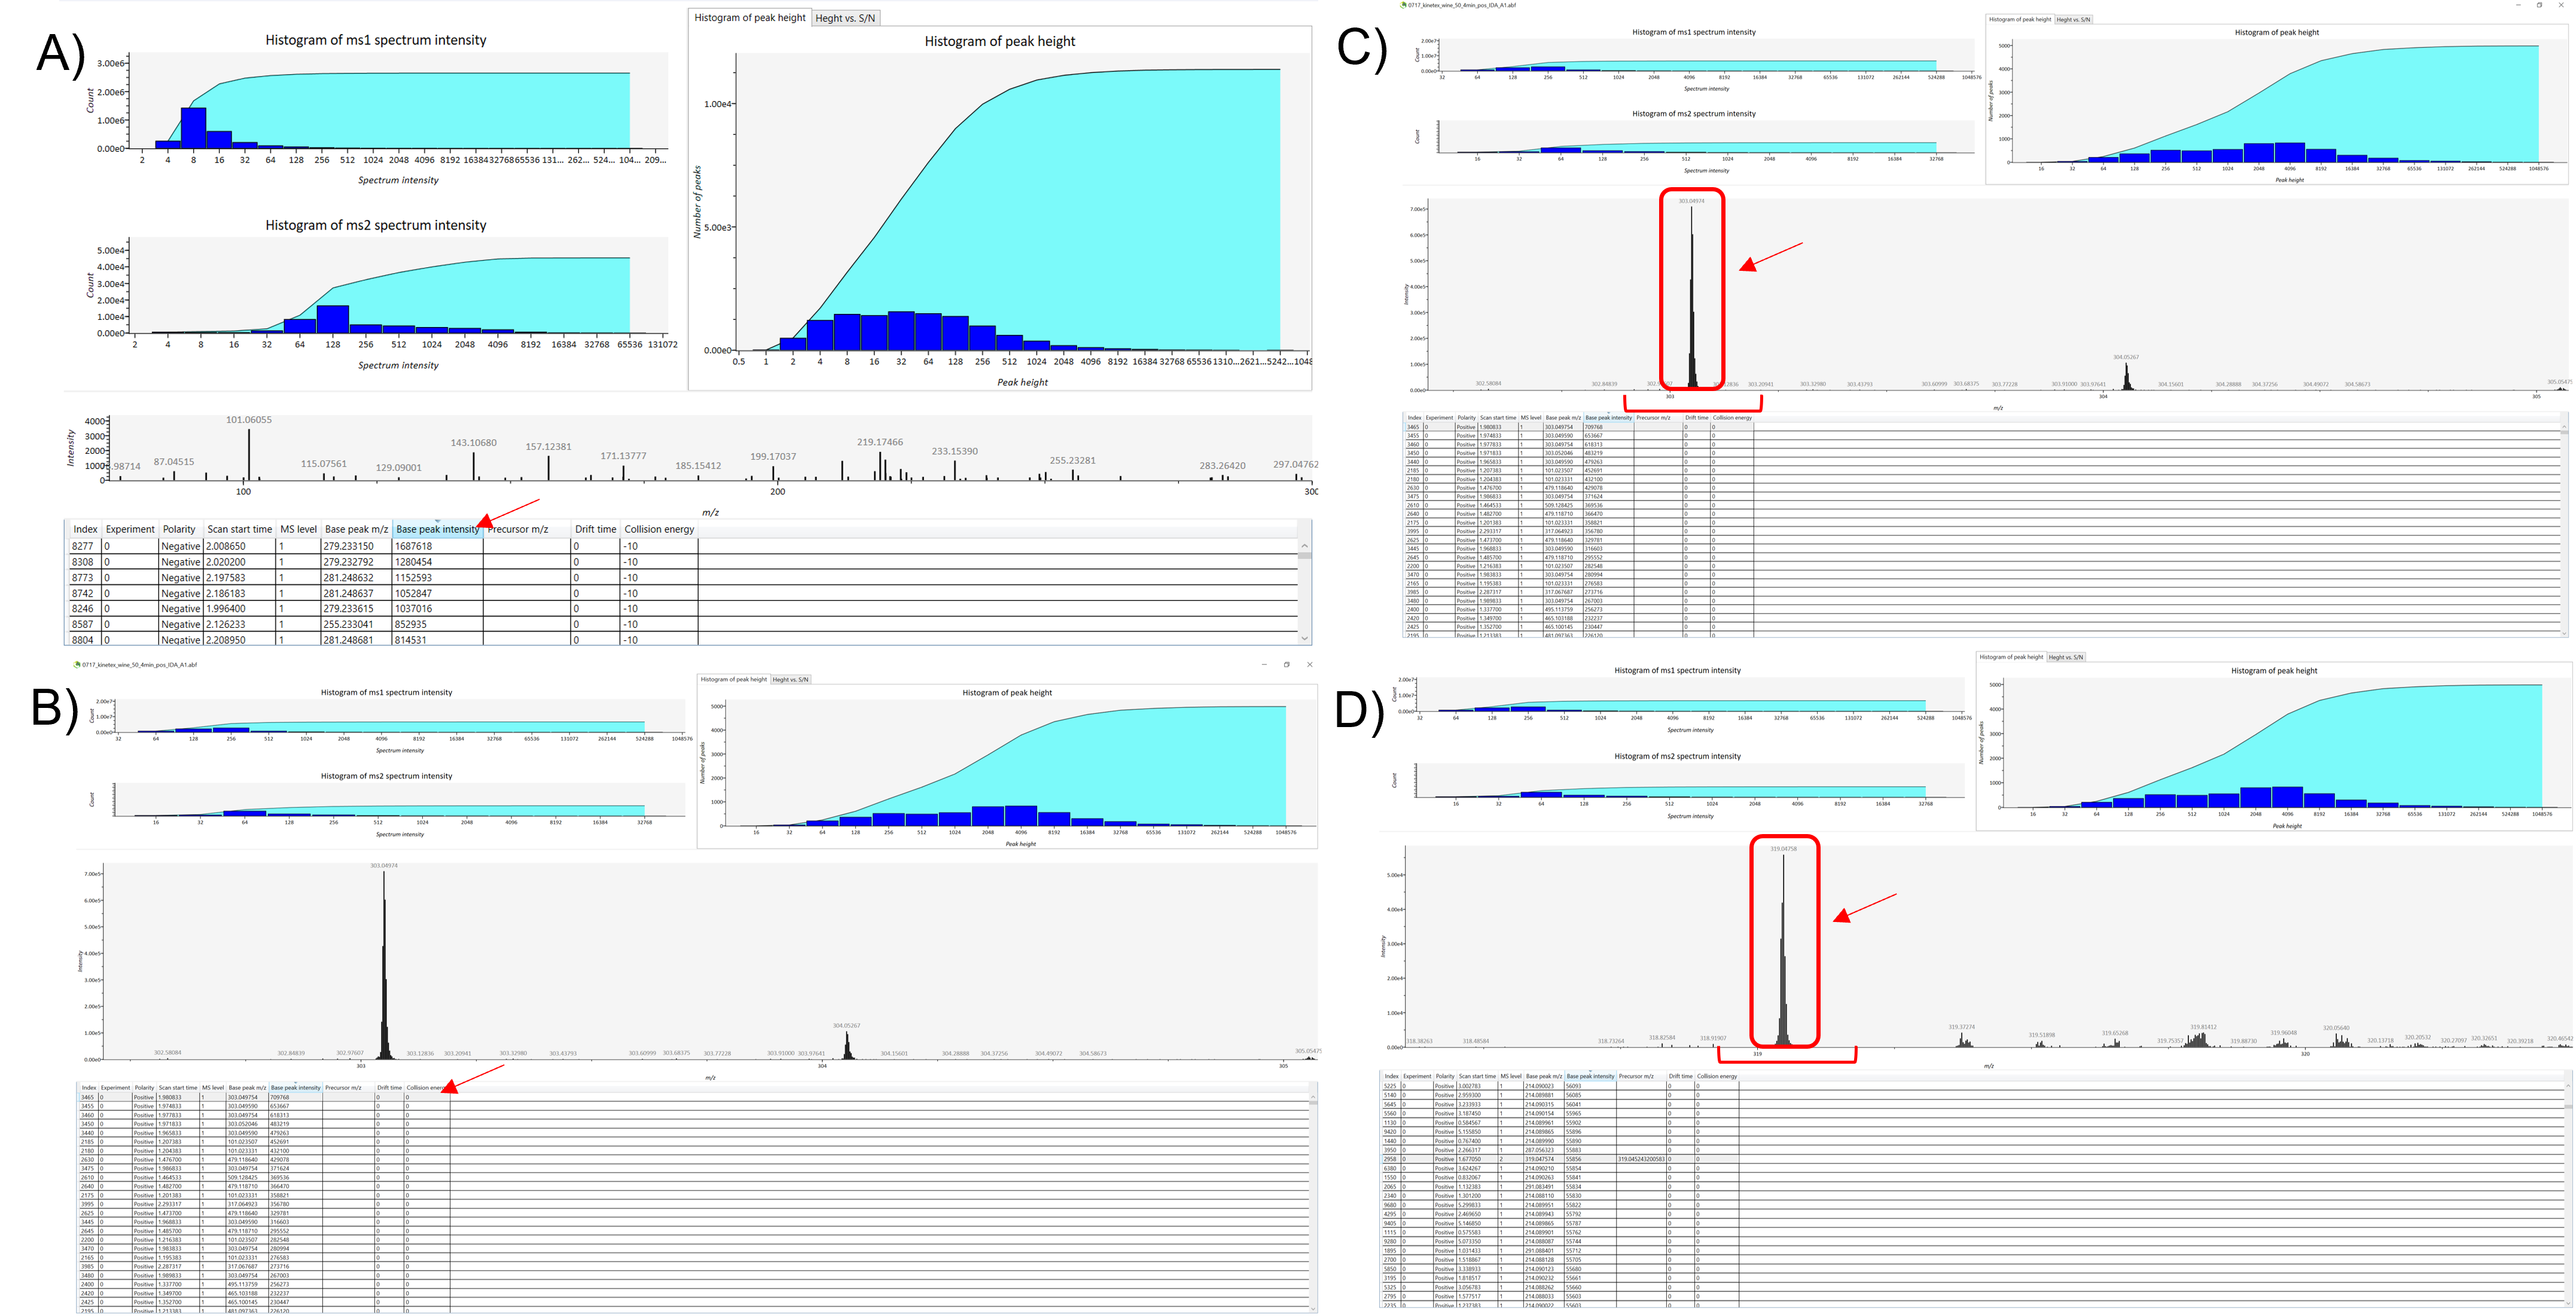
To organize the data, double-click on the base peak intensity column to sort the lipid list in ascending order based on MS levels and peak intensity. To determine whether the MS1 data is centroid or profile, click on the most intense MS1 peak (typically the first peak in the table). Right-click on the peak and zoom to examine the base peak of the selected peak. If the peak appears as a single sharp peak with its m/z value centered at the peak’s highest point, it indicates that the data is in centroid mode. Next, scroll through the table to examine the MS/MS (MS2) data. Select the MS2 peak in the table, right-click, and zoom in on the base peak of the selected peak. The MS2 peak also shows a single, high-intensity peak centered at its m/z value, this confirms that both the MS1 and MS/MS data are in centroid mode (Figure 2).
How to determine profile data?
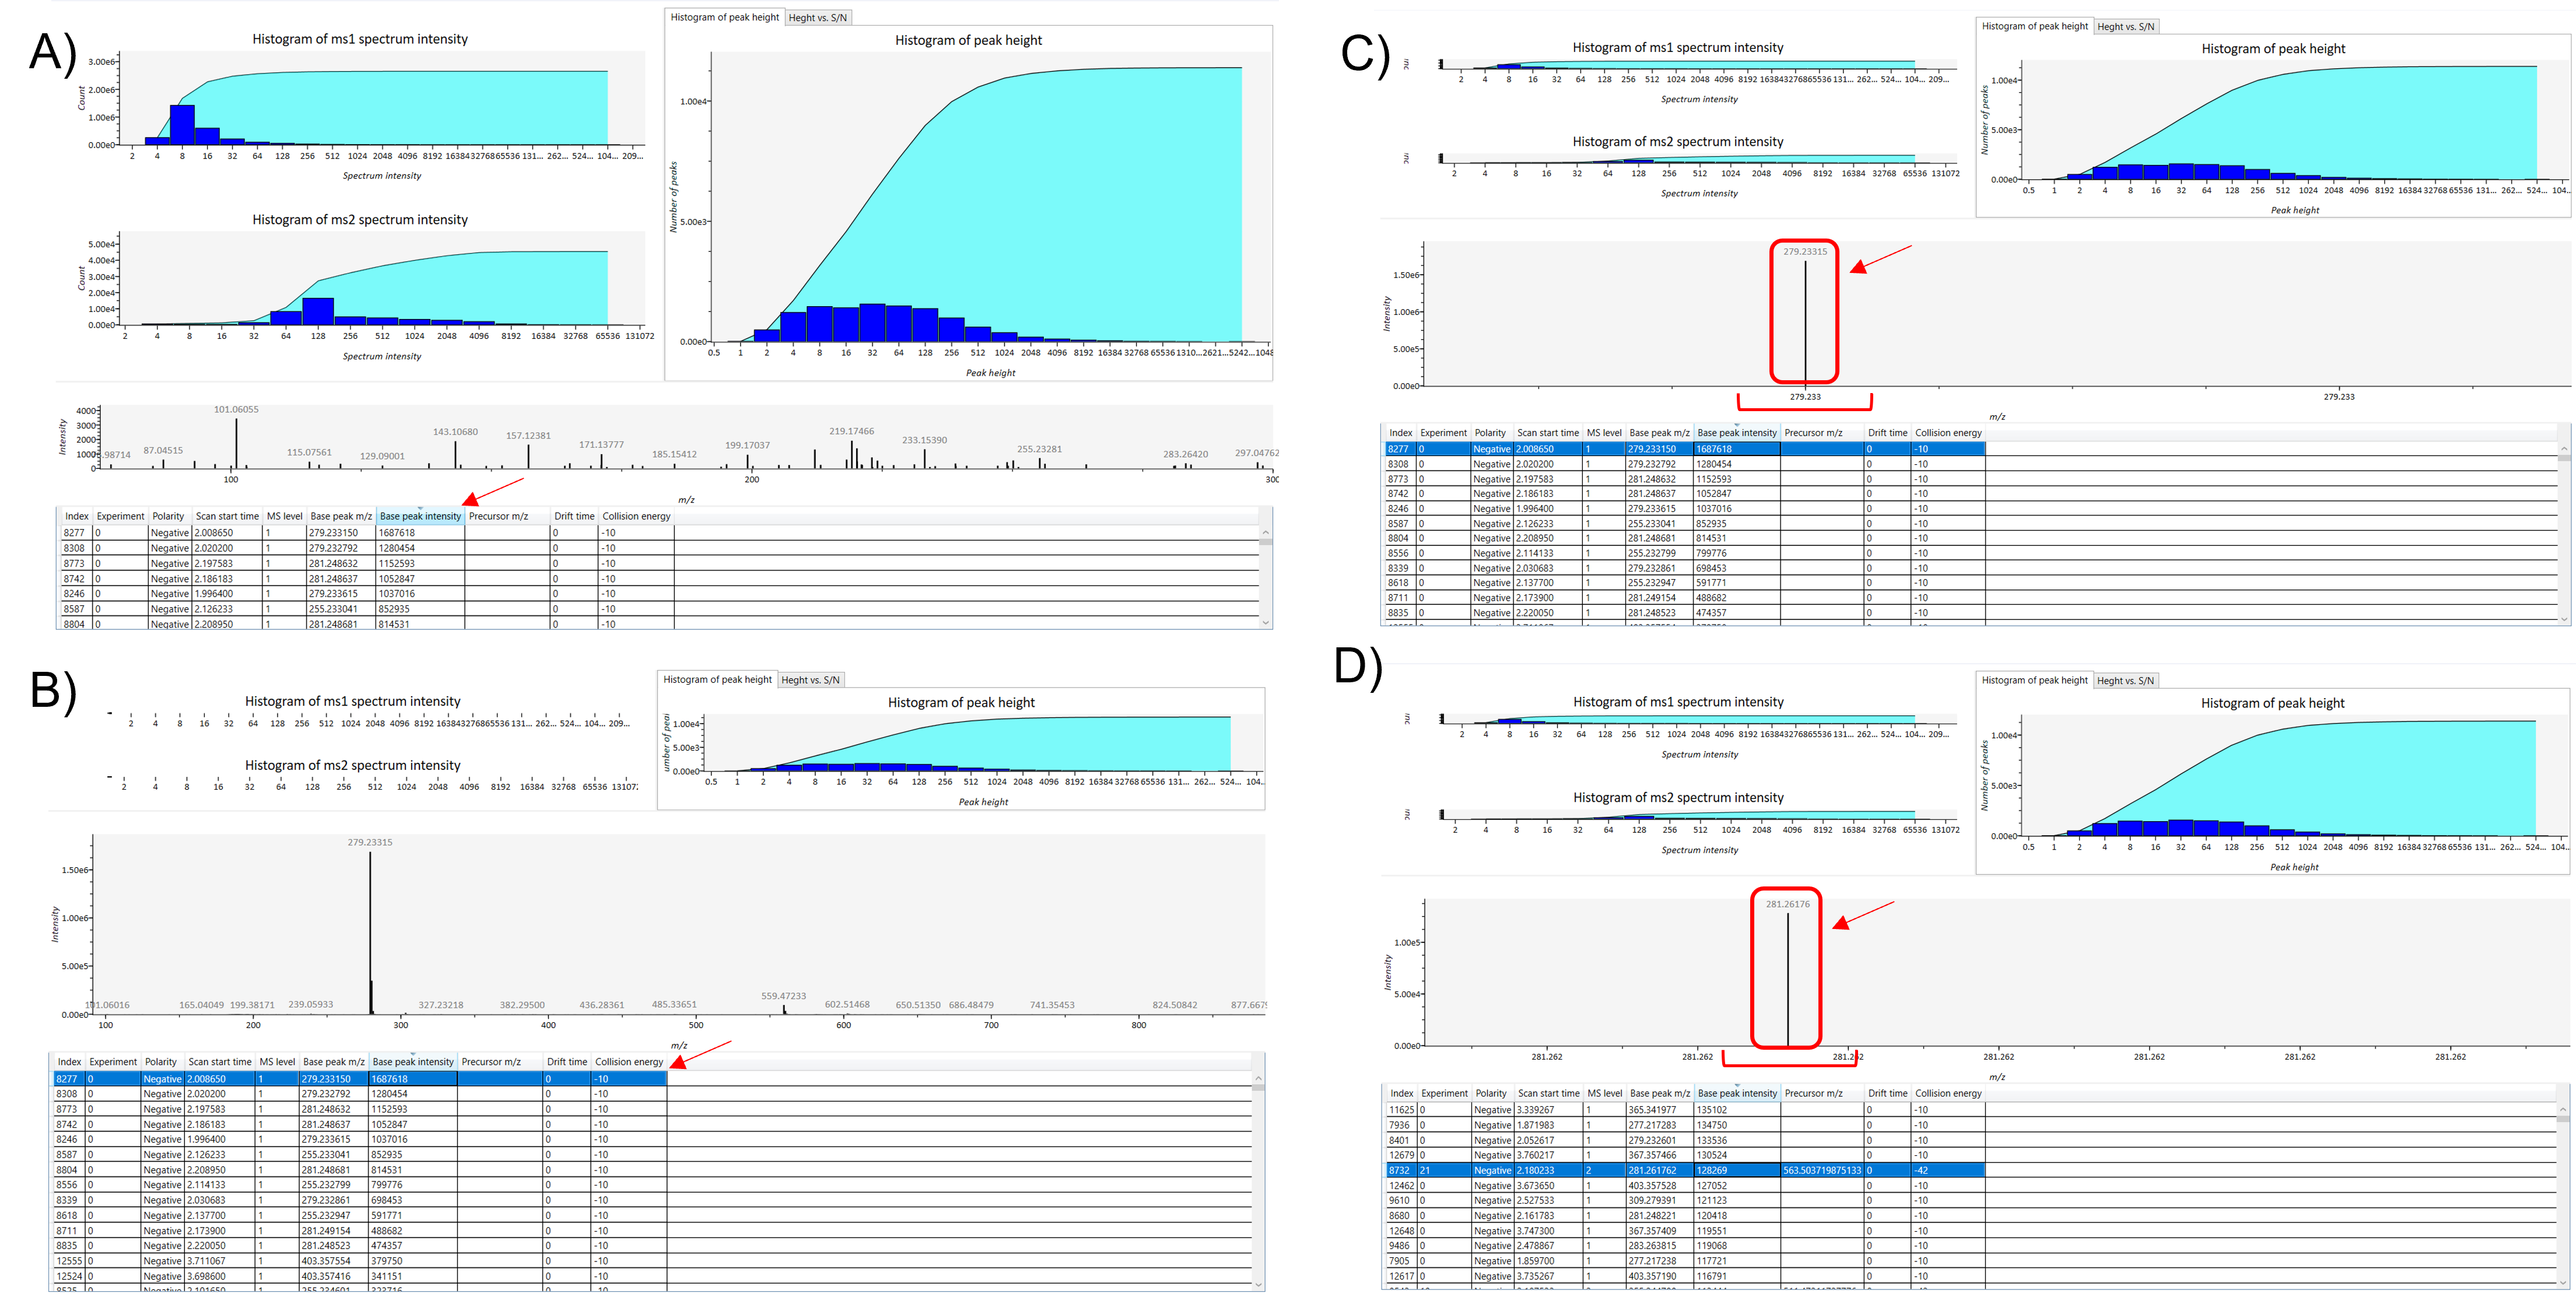
Next, open the raw file and follow the same steps until a new window of histograms of peak height, MS, and MS/MS peak intensity of the selected raw file appears. Double-click on the base peak intensity column to sort the lipid list in ascending order based on MS levels and peak intensity. Select the first peak (MS1) in the table, then right-click, and zoom in on the base peak of the selected peak. The peak appears like a detailed view of the entire peak shape by showing the continuous intensity distribution of the peak across a range of m/z values. it indicates that the data is in profile mode. To check the MS/MS data, scroll down the table. Select the MS2 level peak, then right-click, and zoom in on the base peak of the selected peak. The MS2 peak also shows a continuous distribution of peak intensities, this confirms that both the MS1 and MS/MS data are in profile mode (Figure 3).